Getting to the ‘core’ of silage testing
More and more beef farmers will be taking silage samples as a result of the Beef Welfare Scheme. Patricia Lynch a Drystock Advisor in Teagasc Ballinrobe shares key tips to not only ensure this process is done correctly but to also make sure farmers make use of the resulting analysis.
The last month has not been for the faint hearted. The sudden drop in temperatures, high levels of rainfall and the first of this year’s storms have certainly focused the minds of many to the imminent housing period.
However, after a relatively good season at grass, it’s important that animals continue to thrive during the housing period so that the required turnout targets for the next grazing season can be achieved.
Silage makes up the main component of the winter’s diet and by its nature it is inherently inconsistent in terms of quality, with factors such as cutting date, sward quality and weather at the time of ensiling all impacting on the quality of the forage and leaving farmers in the dark of its nutritional value.
Luckily for the many thousands of suckler farmers that selected forage analysis as a voluntary option in their Beef Welfare Scheme application this year, they will now benefit in knowing the feed value of their forage for the coming winter, thus allowing them to supplement accordingly.
As part of the Beef Welfare Scheme, farmers are paid at a rate of €25 per eligible calf up to a maximum of 45 calves and in return farmers must take three silage samples. The biggest error in forage analysis is improper silage sampling methods, which in turn affects the diet formulation and therefore animal performance.
Silage testing: Taking a silage sample
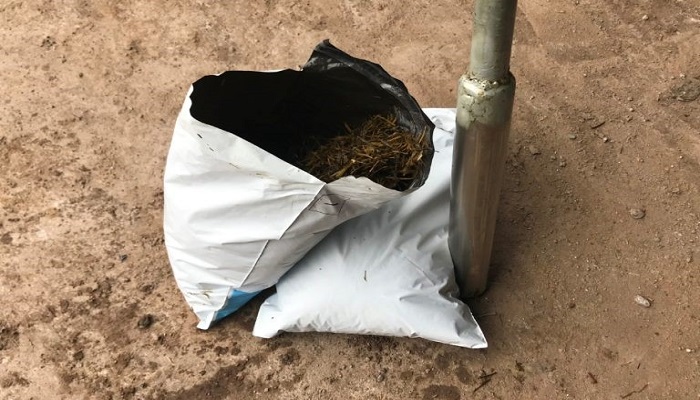
Silage samples must be taken carefully to ensure correct results. A period of 5-6 weeks should elapse between ensiling and sampling. When testing a pit, a long corer should be used with 3-5 cores taken from well-spaced points on or between diagonals on the pit surface. Alternatively, sample a freshly opened pit by taking nine grab samples in a “W” pattern across the face of the pit.
When testing bales, use freshly opened bales, take a few samples from the same batch of bales and mix in a clean bucket. Place the sample in a large freezer bag and dispatch it to the lab immediately. Avoid posting samples on a Friday as the sample will spend the weekend in transit and may deteriorate and give rise to inaccurate results.
What to look at when assessing the silage analysis report?
When looking at the different units of measure in the silage sample, it is important that farmers understand the meaning behind each result. Table 1 below explains each measure while showing farmers the targets of what their silage should be.
Table 1: Key information provided from a silage analysis
| Unit of measure | Target |
| Dry matter (%) | 28-32 |
| pH | 3.8-4.5 |
| Ammonia – N (% of N) | <10 |
| NDF (% DM) | <44 |
| DMD (%) | >72 |
| ME (MJ/kg DM) | >11 |
| UFV/UFL (unit/kg DM) | >0.89 |
| Crude protein (% DM) | >13.5 |
| Ash (% DM) | <8.6 |
Dry Matter (DM%)
This is the amount of silage material after water has been removed. Generally, the higher the Dry Matter the higher the potential intake of silage. However, silages that are too dry can give rise to moulds and heating.
Fermentation
Fermentation is described by pH, Ammonia and Lactic Acid. pH, normally 3.8-4.5, measures the silage acidity and so the ability of the silage to store. Reduced intakes can occur with too low a pH while a high pH in low dry matter silages can be an indicator of poor fermentation. Ammonia is a useful indicator of fermentation quality. Ammonia values of less than 10% are desirable while values greater than 15% can cause reduced intakes resulting in poor animal performance. High nitrate levels in the grass will contribute to this.
Crude protein
Crude protein levels are a direct reflection of the quality of grass at the time of harvest. Young, leafy grass produces high protein silage while older stemmy grass produces low protein silage. Protein levels in grass can also be much higher earlier in the silage season than in mid-summer.
Metabolisable Energy (ME)
Metabolisable Energy measures the usable energy of the silage which is higher at the young leafy grass stage and lower at the hay stage.
Dry matter digestibility
The Dry Matter Digestibility (DMD) is an accurate and reliable test of forage feeding value. The DMD result is used to estimate energy of the silage, as well as expected live weight gains/milk yields and in planning supplementation rates.
Supplementation rates
Table 2 below shows how silage quality affects supplementation levels when trying to achieve the target average daily gain (ADG). So, knowing the quality of your silage is the first step in getting diets correct for all your livestock over this coming housing period.
Table 2: Guideline daily feeding rates based on silage quality (DMD)
| Animal type | Target ADG | 66 DMD | 68 DMD | 70 DMD | 72 DMD | 74 DMD | 76 DMD |
| Weanling | 0.6kg/day | 1.8kg | 1.5kg | 1.2kg | 0.9kg | 0.6kg | 0.4kg |
| Finishing steer | 1kg/day | 7.0kg | 6.0kg | 5.5kg | 5.0kg | 4.0kg | 4.0kg |
| Finishing heifer | 0.9kg/day | 7.0kg* | 6.0kg | 5.5kg | 5.0kg | 4.0kg | 4.0kg |
For more insights on the importance of silage testing and formulating diets for the winter months, James Strain, nutritionist with Inishowen Co-op, joined a recent episode of the Beef Edge Podcast to ‘Winter Nutrition’. Listen in below:
More from Teagasc Daily: Reach for the measuring tape before housing stock
More from Teagasc Daily: Weanling performance: Silage quality is everything