![]()
Nutrient SOURCES in Agricultural Catchments
Dr Noeleen McDonald
Background
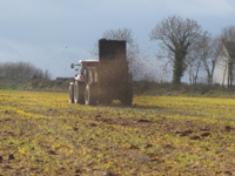
Nutrient management within an agricultural catchment is primarily focused on increasing farm productivity (crops, livestock and milk production). In the coming years there will be renewed focus on this, given the ambitious targets for increased agricultural production set out for Ireland in the Food Harvest 2020 report. However, nutrients in the form of slurries or fertilizer, for example, can form a source for loss to water or air which can have both economic and environmental implications. The ACP focuses primarily on N and P management and sources, as these are the principle nutrients of concern with regard to water quality. Optimising the use of on-farm (Fig 1) and purchased feeds and fertilisers (Fig 2), can both increase farm productivity and decrease environmental impacts; a win-win scenario leading to more sustainable farming. The nutrient SOURCES component of the ACP is concerned with assessing the management, magnitude and mobilisation potential of N and P sources in each catchment. These potential sources can be divided into: 1. point sources, such as farmyard sources (e.g. slurry tanks), and 2. diffuse sources, such as fertilizers applied in the fields. The ACP is assessing how the GAP measures affect these nutrient sources and how this, in turn, affects both farm productivity and nutrient mobilisation and transport to surface waters.
|
Figure 1. Farmyard manure, recycled and spread as a nutrient resource. |
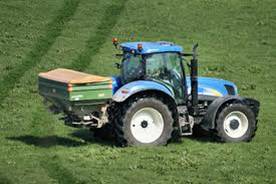
Figure 2. Fertilizer, imported onto the farm and spread. |
|
Figure 3. Ploughing and establishing a winter wheat crop in compliance with the green cover rules to reduce N losses to water over the winter period |
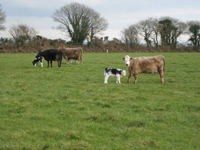
Figure 4. Maximising the conversion of P to grass and then meat/milk and minimising losses to water links economic and environmental objectives. |
Methods
Catchments were selected to represent different N and P loss risks associated with different farming practices (dairy, dry stock and tillage), soils, geology and climates in intensively farmed regions of Ireland. In terms of the farm/soil as a nutrient source, six main areas of work are being undertaken:
- A soil nutrient census has been conducted in each catchment to characterise the spatial distribution of soil P status and also K and pH status at a resolution of < 2 ha (e.g. Fig. 5). This allows identification of soils with low, appropriate or excessive P status. Excessive soil P status can be an indicator of P loss risk. ACP advisors use this information in nutrient management plans for each individual farm to improve P use efficiency and farm productivity. This census will be repeated to assess how soil P status has changed over time in response to management practices in the GAP measures.
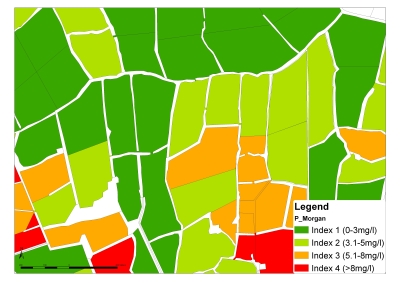
Figure 5. An example of soil P results for fields within a catchment
- Information on nutrient management and flows, such as fertilizer use, feed, fertilizer and livestock import and export and farm products exported is being recorded at the field and farm scale in each catchment. This information will be used to calculate N and P balances at the field, farm and catchment scales (Fig. 6). Nutrient balances allow calculation of nutrient use efficiency; an indicator of the sustainability and efficiency of the farm production system. Nutrient balances are also an indicator of nutrient loss risk; nutrient surpluses are associated with greater risk, and can help identify management practices that may improve efficiency and decrease loss risks. In conjunction with the ACP advisors, this information is used for improved nutrient management recommendations and advice.
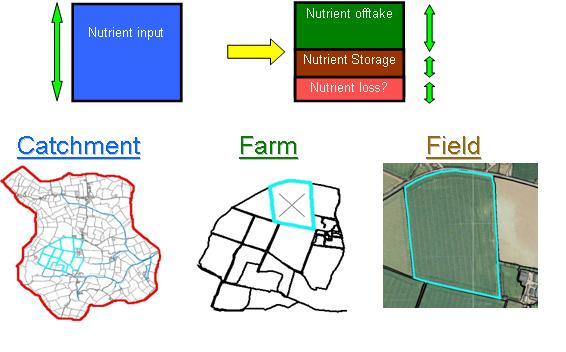
Figure 6. Nutrient balances at the catchment, farm and field scales
- The representative soils of each catchment are being classified and mapped and characterized both physically (soil texture, bulk density etc) and chemically (pH, organic matter, P sorption/desorption, P buffering capacity etc) and characteristics such as drainage class are being defined (e.g. Fig. 7). Soil maps are being developed for each catchment based on field soil survey, topographic analysis of digital elevation models (DEMs) and other data sources (Fig. 8). This information helps to characterise nutrient mobilisation and transport pathways and nutrient loss attenuation in the catchments.
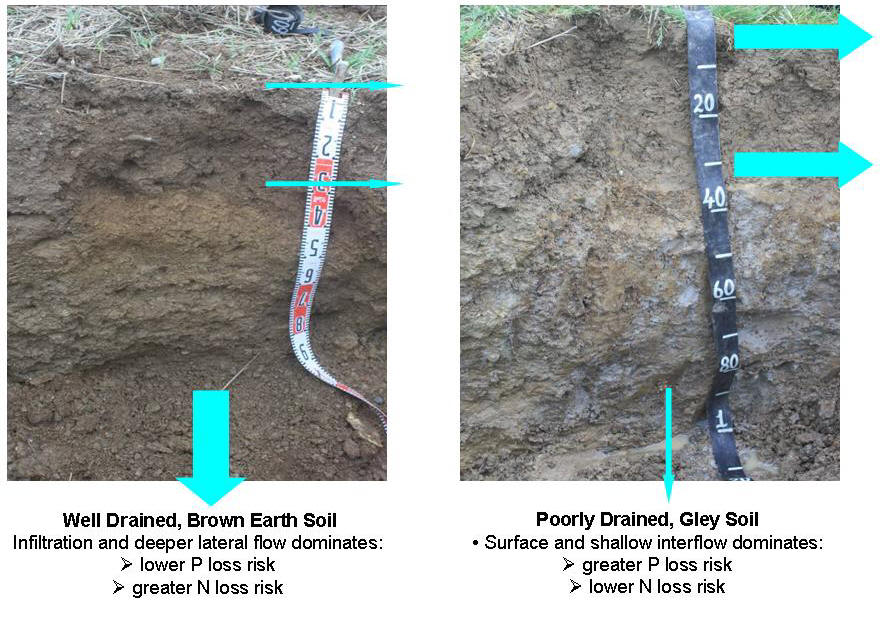
Figure 7. Two contrasting soil types and their effect on flow pathways and nutrient loss risk.
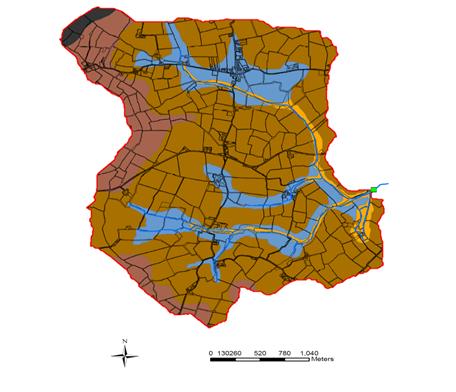
Figure 8. Soil maps are being developed to characterise the soils of the catchments.
- At specific sites intensive investigations of potential N and P mobilisation and transport is being conducted. This includes assessment of nutrient leaching and runoff potential, temporal soil mineral N levels and mineralization rates, and soil P levels and transformations. In conjunction with data from the PATHWAYS and DELIVERY components of the ACP, this information will contribute to our understanding of the processes involved in nutrient mobilisation and loss and how management practices affect them.
- Critical Source Areas (CSAs) for nutrient loss are being investigated. CSAs are areas that contribute disproportionately to the total nutrients lost from a catchment. Identifying these areas may help target mitigation strategies in the future to achieve the greatest impact on water quality for the minimum cost. A range of CSA factors are being investigated to determine the key factors that would allow mapping of CSAs. These include factors such as soil P status, soil type, slope and hydrologic connectivity to water receptors, for example.
- The ACP has now acquired high resolution (25 cm) Light Detection and Ranging (LiDAR) digital elevation models (DEMs) to characterise the topography of the catchments (Fig. 9). This cutting edge technology is being used, along with other geospatial data, in a geographic information system (GIS) to advance our understanding of spatial relations in Irish agricultural catchments/landscapes; to investigate the spatial distribution of soils, CSA’s and flow pathways in the landscape, for example. These investigations will also lead towards modelling of catchment hydrology and nutrient losses using high resolution nutrient SOURCE, PATHWAY and DELIVERY data. This component of ACP work will shed light, not only on important processes occurring in Irish agricultural catchments but also, critically, on management practices and strategies that may help decrease nutrient losses to water while also improving farm efficiency and profitability.

Figure 9. LiDAR DEMs with vegetation (a) and without vegetation (b).
- A Farm Facilities Survey (Fig. 10) is being carried out to assess farm yards for potential point sources of nutrient loss. This survey will assess farmyard facilities, such as hard areas, slurry and silage storage and guttering, and also farmyard management. ACP advisors will provide recommendations for improvement to farmers as a result to minimise risks of nutrient loss from farmyards.
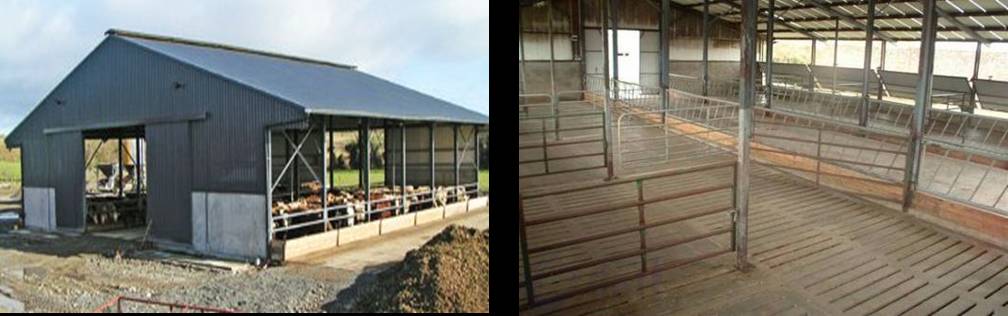
Figure 10. Farm facilities are being surveyed.
Outcomes To-date
-
In 5 ACP catchments, between 6 and 26 % of soils (by area) had excessive P status (Index 4), showing the legacy of historic P surpluses on these fields. Of course, this means that between 74 and 94 % of soils had optimal P status, or lower. For the grassland catchments, soil P status reflected land use intensity with 26 % of soils in Index 4 in the intensive dairy catchment, decreasing to 16 and 6 % with decreasing land use intensity in the other two grassland catchments. The two arable catchments had a similar proportion of Index 4 soils, at 18 and 19%.
-
Large spatial variability was found in soil P status both across a catchment and between individual fields on the same farm (Fig. 5). This large variability in soil P status indicates that there is plenty of scope to correct nutrient imbalances with better nutrient management and redistribute P to lower status soils, potentially increasing P use efficiency and decreasing P loss risk.
-
Significant differences were found between catchments in the relationships between soil P status (degree of P saturation (DPS)) and the tendency of soil to release P to water (water soluble P (WSP)), reflecting different soil types. This implies that, for a given management and resulting soil P status, the risk of P loss to water, based on soil P status alone, may differ between different soils and different catchments. For example, the medium intensity grassland catchment (Ballycanew) had the highest WSP levels for a given level of DPS, indicating a greater risk of P loss to water for the same soil P status. This is consistent with observed P losses from this catchment and indicates that different P management strategies may be required here. Soil-related considerations may need to be taken into account when evaluating the efficacy of the GAP measures and the constraints they place on farm management practices.
-
Under the GAP measures, it is expected that high P (Index 4) soils will be brought down to optimal levels (Index 3) over time due to P deficits on these soils; i.e. more P is taken off the field than is put on. At a field P deficit scenario of -7 kg P ha-1, using modelling, it was predicted that an average of between 5 and 20 years would be required for all Index 4 soils in the catchments to reach Index 3. At -30 kg P ha-1 it was predicted to take between 2 and 10 years. These predictions highlight the likely time lag between implementation of soil P mitigation regulations and the desired outcome of few or no fields with excessive soil P. Expectations for water quality improvement through diffuse P source mitigation should factor in this time lag between implementation of a measure and mitigation of a source.
-
Comparisons from two grassland and two arable catchments showed that between 29 and 40 % of P exports occurred during the closed period for slurry spreading, supporting the utility of the closed period to avoid incidental P losses. Higher P exports from two catchments were attributed to lower soil permeability in these catchments, leading to flashier runoff (and P mobilisation into fast pathways), more so than to landuse or the magnitude of the P source (soil P status). This shows the importance of soils and hydrology in determining risks of nutrient loss to water, in addition to management practices.
-
Whole farm P balances for 5 farms (one in each catchment) showed that the dairy farm in the lowest intensity grassland catchment had the highest farm gate surplus (16.5 kg ha-1), while the beef-tillage farm in the winter-wheat dominated Arable catchment had the highest farm gate deficit (-12.6 kg ha-1). The tillage-sheep farm in the spring barley-dominated arable catchment (1.7 kg ha-1), the dairy farm in the intensive dairy catchment (1.9 kg ha-1) and the beef-sheep farm in the grassland catchment of intermediate intensity (-0.7 kg ha-1) were closer to being in balance. However, when the soil P requirement is considered (level of fertiliser P required to build-up and maintain agronomic soil P levels), these balances become negative, even for the highest surplus dairy farm above. An intensive dairy farm with a N derogation in the intensive dairy catchment had just 4 % of the farm area requiring soil P additions and low P fertiliser imports on this farm resulted in an overall farm P deficit of -4.5 kg P ha-1.
-
Analysis of field-level chemical P fertiliser inputs revealed a large range across fields, from no fertiliser applied to maximum rates (55 kg ha-1 for grassland and 68 kg ha-1 for arable crops) in excess of the maximum allowed under the NAP, in some cases. These excessive applications are likely to increase the risk of P loss. When compared to estimated crop requirements, one of the arable catchments and the lowest intensity grassland catchment had P input balances (chemical fertilizer P – estimated P requirement) of +5 and +2 kg ha-1, respectively, on the grassland area, while the highest and medium intensity grassland catchments had P input balances of -5 and -1 kg ha-1, respectively. For arable crops in all catchments, there was an input P deficit with large deficits associated with winter wheat and maize silage production.
-
The importance of scale is often not well understood or accounted for when assessing nutrient management and losses in agricultural systems. This research has shown that trends in soil P status, fertiliser P inputs and surplus P availability can be misrepresented at larger scales (national, catchment, farm scale) and may be better represented at smaller scales (field, soil process scale) where management and soil factors can be considered.
-
A Critical Source Area management approach may be needed to optimise nutrient management. Critical source areas may be a small proportion of the total area of the catchment but can contribute a large proportion of total nutrient exports.
-
A better understanding of nutrient source management in relation to regulatory requirements is needed to establish whether current policy instruments will bring about the desired reductions in nutrient losses and improvements in water quality and the timescales within which such improvements can be realistically expected.