14 June 2023
Higher cattle prices boost beef finisher farm incomes in 2022
Improvements in finished cattle prices had a positive impact on the levels of income generated on ‘cattle other’ farms – typically cattle finishing farms – as reported in the National Farm Survey 2022 report, which was published earlier this week.
Representative of approximately 30,327 farms, a 9% increase in the average Family Farm Income (FFI) – climbing to €18,811 – was recorded in 2022 when compared to year earlier levels. Typically, the average output value per ‘cattle other’ farm increased by 25% in 2022 due to an improvement in finished cattle prices. The value of gross output was €72,387, on average.
There was a slight increase (up 3%) in the level of direct payments on ‘cattle other’ farms in 2022, totalling €16,183 on average. Sector specific payments made through the BEEP-S and BDGP continued to contribute positively to farm income in 2022. On average for participant farmers, these payments were approximately €2,300 for BEEP-S and €2,500 for BDGP. In 2022, the average payment received through the Fodder Support Scheme on ‘cattle other’ farms was close to €1,000. This related to almost 90% of farms.
Table 1: Components of average ‘cattle other’ Family Farm Income 2022
| 2022 | 2022/2021 change | |
|---|---|---|
| € | % | |
| Gross output | 72,387 | +25 |
| Of which Direct Payments | 16,183 | +3 |
| Total costs | 53,576 | +31 |
| Of which direct costs | 26,269 | +29 |
| Of which overhead costs | 27,307 | +33 |
| Family Farm Income | 18,811 | +9 |
Total costs
In 2022, total costs increased by 31% on ‘cattle other’ farms compared to 2021. On average, direct production costs increased by 29%. Typically, expenditure on purchased concentrates increased by 36% to €10,740 on average, with usage up marginally.
As with the other farm systems in 2022, there was an increase in average spending on fertiliser, which rose by 74% to €6,398. In terms of usage, there was an average reduction in nitrogen application of 35%. Average contracting related costs increased by 22% on these farms in 2022, at €4,586. Although a more minor cost, expenditure on purchased bulky feed also increased to €635, on average. Average expenditure on livestock and veterinary increased by 3% year-on-year to €2,401, with other direct costs up 29% to €1,820.
Overhead costs
On average, overhead costs increased by 33% in 2022, relative to the previous year. Increased depreciation costs were evident across machinery and buildings, both increasing by 65% to €5,412 and €4,142 respectively. Expenditure relating to land improvement maintenance also increased to €1,311, on average.
Buildings maintenance was up 12% to €1,046, on average. Machinery operating costs also increased, up 23% to €4,562, on average, with fuel up 51% to €2,248. Other overhead costs came to €3,304 in 2022, up 19%, on average. Expenditure relating to car, electricity and phone also increased by 19% to €3,486, with rent of conacre up 24% to €1,985 year-on-year.
Concentrate feed usage
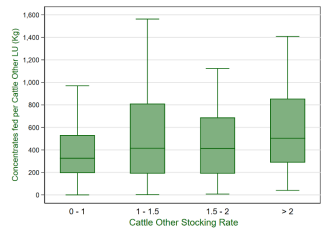
Concentrate feed use on ‘cattle other’ farms in 2022 by stocking rate band is presented in Figure 1. The data illustrate the variation across farms within stocking rate bands. The median value of concentrate use per LU in the lowest (0-1LU) stocking rate band was lowest at 326kg. Concentrate usage was similar across the 1-1.5LU and 1.5-2LU stocking rate bands, at 414kg and 413kg respectively. The most intensively stocked ‘cattle other’ farms (above 2LU) had a median feed use of 503kg.
Figure 1: Concentrate feed use per livestock unit on ‘cattle other’ farms in 2022
Land area
Table 2 indicates that the average Utilised Agricultural Area (UAA) on ‘cattle other’ farms in 2022 was 37ha, up 3% compared to 2021. Total livestock units increased by 4% to 49. Taking account of the change in farm size, average gross margin per hectare on ‘cattle other’ farms increased by 18% in 2022, to €1,240. This margin was inclusive of an average Basic Payment of €291, which was relatively unchanged compared to 2021.
Table 2: Average ‘cattle other’ farm indicators 2022
| 2022 | 2022/2021 change | |
|---|---|---|
| Farm size (ha) | 37 | +3% |
| Livestock units | 49 | +4% |
| Livestock units per ha | 1.32 | – |
| Basic Payment (€/ha) | 291 | +1% |
| Gross margin (€/ha) | 1,240 | +18% |
Distribution of income
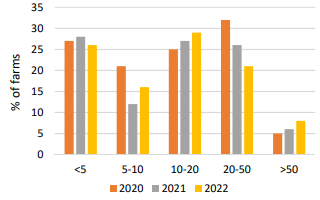
Figure 2 presents the distribution of average income on ‘cattle other’ farms in 2022. The proportion of farms in the lowest income category declined marginally to 26%, compared to 2021. The proportion of these farms earning between €5,000 and €10,000 also increased to 16%, as did those in the €10,000 to €20,000 bracket, at 29%. The proportion in the €20,000 to €50,000 income category declined by 5 percentage points to 21% in 2022. There was a marginal increase (up 2 percentage points) in the proportion of such farms earning more than €50,000, at 8% on average in 2022. It should be noted that 44% of ‘cattle other’ farm holders also worked off-farm in 2021.
Figure 2: Cattle other Family Farm Income distribution 2020-2022
Variation by farm area
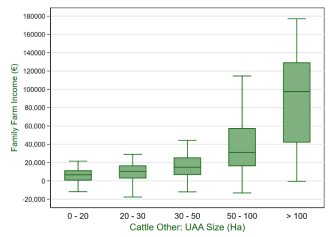
Figure 3 reflects the variation in average FFI by farm area, with a broad distribution of FFI reported for those farms in the larger size classes in particular. In terms of the overall population, approximately 7% of farms fall into the greater than 100ha size category, with 27% in the 50-100ha bracket and a further 27% in the 30-50ha category. A further 25% of ‘cattle other’ farms were in the 20-30ha category, with the remaining 13% comprising farms of less than 20ha.
Figure 3: Distribution of ‘cattle other’ Family Farm Income by farm size 2022
This article was taken from the Teagasc National Farm Survey 2022 Preliminary Results
Also read: Increase in farm incomes largely confined to dairy and tillage farms in 2022
Also read: Milk price rise offsets steep production cost increases on dairy farms in 2022
Also read: 21% decline in sheep family farm income in 2022