03 November 2023
Feeding for higher profit
Emer McCrum, Michael McKeon and Gerard McCutcheon tell us that as a country with a relatively low percentage of its land base utilised for tillage (12%), by necessity our pig sector has to import a significant amount of feed ingredients.
Due to importation costs unfortunately these ingredients costs will be higher than most of our European neighbours. Therefore there is a high emphasis on maximising the growth rates and optimising feed conversion efficiency (FCE) arising from our pig diets.
Feed conversion efficiency & growth rate improvement
Over the past 20 to 25 years the emphasis on these two Key Performance Indicators (KPIs) have delivered considerable improvements due to better feed quality, housing standards and genetic improvement. The growth rate has steadily increased from 585g / day in 2000 to 736g /day on 2022, a 26% improvement. The FCE improvement journey has not been as steady. It started at 2.35 (year 2000) and deteriorated from 2010 to 2014 due to herd health issues before improving again from 2015 onwards. There was a small deterioration in the trend in 2022 as a result of the sectors economic difficulties. While the FCE in numerical terms may not appear to have improved, it must be noted that the finisher pig live sale weight increased by 28 kilograms (90 to 118 kg) over this 23 year period. Therefore maintaining a relatively steady FCE during this timeframe is a significant gain in real terms.
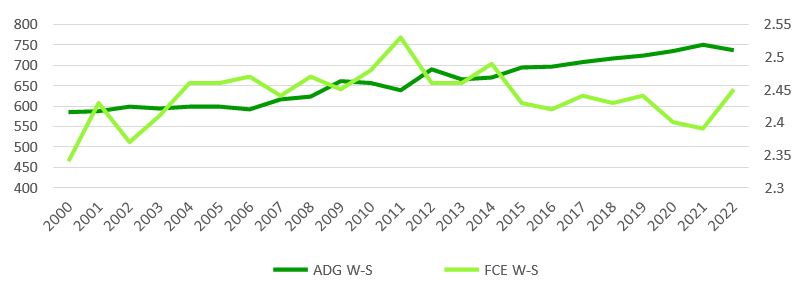
Figure 1. Growth rate and FCE trends from 2000-2022. Source: Teagasc Pig development Department.
The increase in growth rates has also been largely responsible for the substantial increase in pigmeat output per sow per year. Over the 23 year period the output per sow has increased by 68% (1,471kg to 2,482kg).
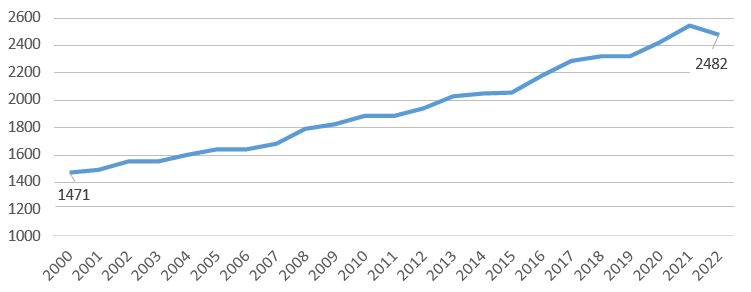
Figure 2. Pigmeat output per sow per year from 2000 – 2022 (kg per sow). Source: Teagasc Pig development Department.
This increased output per sow is very important as it has helped to defray / dilute some of the substantial non-feed cost increases over the 23 year period e.g. labour, energy, healthcare, repairs, etc. If our sale weight and pigs produced per sow had not increased since 2000 then our non-feed costs would be 17 cent higher per kilogram dead weight, equivalent to an increase of 33%.
Is this the correct road?
While our focus on growth rates and feed conversion has undoubtedly delivered improvements over this time period, are they the correct KPI’S to chase after? Would achieving more moderate growth and FCE performance on a ‘per kilogram of pigmeat produced’ basis, have delivered better profitability? This more moderate performance approach is being taken by some other European countries through the use of different genetic breeds or through lower feed specifications. Spain and the Netherlands both target a moderated growth performance approach to achieve lower feed costs.
Spain
The Spanish system uses the Pietrain breed to achieve lower feed costs. The Pietrain cross slaughter progeny have lower feed intakes, a slower growth rate and therefore take longer to reach sale weight. The advantages of this breed is that they convert feed extremely efficiently and have a very high meat content / kill-out percentage (Table 1).
Table 1. Comparison of Irish & Spanish Performance.
| Production standards | Spain | Ireland |
| No.Pigs per sow per year | 23.6 | 27.4 |
| Weaning WT kg | 6 | 7.2 |
| Weaning age days | 23 | 31 |
| Transfer wt to finisher kg | 18.4 | 38.4 |
| Age at transfer to finisher days | 70 | 91 |
| Weaning – sale ADG g/day | 633 | 736 |
| Weaning – sale fce | 2.34 | 2.46 |
| Finisher sale weight (dead)kg | 87.5 | 90.6 |
| Feed costs c/kg dwt | 145 | 148 |
A number of important differences can be observed between the two data sets. The Spanish weaning age (23 days), age at transfer to finishers (70 days), transfer weight (18 kg) and sale weight (88kg) are much lower. However their FCE is substantially better, even allowing for their lower sale weight.
While this system works for the Spanish industry, it would have two major drawbacks for the Irish sector if implemented here. The first issue is that the significantly slower growth rates would lead to lower sale weights which would increase our production cost. While we could build additional finisher housing on our pig units to maintain the sale weight, the older age of the male pigs could cause boar taint issues. The second obstacle with this system is that we export a relatively small but lucrative percentage of our pigmeat to Japan. Pork from a very lean Pietrain-cross slaughter pig would not be appreciated by the Japanese consumer and could lead to the loss of this market.
However maybe a ‘halfway house’ would be a better match? Could we moderately reduce our feed specification, which may lower our growth rates but may also lower our feed costs?
The Netherlands
The Netherlands have similar genetics, pig buildings and industry structure as ourselves. They have a small agricultural land-base, like ourselves and import most of their pig feed ingredients. The Dutch- Irish Interpig figures demonstrate a very similar feed cost on a ‘cost per tonne’ basis but on a ‘feed cost per kg deadweight sold’ the Dutch are substantially lower (14.7 cent). This feed cost differential can be attributed to two important factors; they have a higher number of pigs produced per sow and they have a different philosophy on feeding weaner-finisher pigs.
Table 2. Feed cost comparison c/kg. Source: Interpig
| Netherlands | Ireland | Difference | |
| Feed cost /kg pig meat c/kg | 134 | 148 | 14 |
Pigs produced per sow: The higher number of pigs sold per sow when compared to Ireland, means that the cost of the sow feed usage is diluted across the extra pigs sold (see Table 3). This reduces the overall feed cost by 4.7c/kg dead weight (dwt) sold.
Table 3. Effect of Sow output on feed cost. Source: Interpig
| Netherlands | Ireland | Difference | |
| Pigs Produced/Sow/Year | 31.0 | 27.4 | |
| Sow Feed Per Sow Per Year | 1.34 | 1.38 | |
| Cost of sow feed per Pig € | 17.38 | 20.65 | |
| Cost of sow feed / kg dwt sold c/kg | 18.1 | 22.8 | 4.7 |
Weaner – finisher feed philosophy: The Dutch philosophy for feeding pigs in the weaner and finisher stage is to avoid ‘overloading’ the young pigs digestive system thereby getting better gut health (less scour), which in-turn generates better feed conversion in the finisher stage. As pigs consume approximately 65% of the total feed in the finisher stage, a good FCE in this stage will have the biggest overall effect on feed cost/kg.
To achieve this philosophy they start feeding pigs on lower specification creep-link diets and move them onto the subsequent diets faster than we do.
Weaners are moved at a much lighter weight on to finisher feed (26 kg) when compared to our transfer weight (38kg). This automatically lowers the specification and the cost of the diet faster than in our system. Moving pigs onto finisher feed faster reduced the overall feed cost by 1.7c/kg dwt sold.
Table 4. Effect of a lower transfer weight to finisher stage on feed cost. Source: Interpig
| Netherlands | Ireland | Diff | |
| Transfer weight to finisher | 25.9 | 38.4 | 12.5 |
| Extra kg feed used (12.5kg * 2.1 FCE) | – | 26.25 | |
| Cost differential (weaner vs finisher feed) / pig | – | €1.58 | 4.7 |
| Cost differential per kg dwt sold c/kg | – | – | 1.7 |
The Dutch finisher FCE is significantly better than ours, especially when one considers their higher sale weight and that they produce a significant percentage of castrates. To estimate the effect of their superior finisher FCE it is necessary to estimate the weaner and finisher feed usage/cost together and then subtract the financial saving (1.74c/kg) from transferring earlier onto the finisher diet (Table 4). The total saving arising from the superior Dutch finisher FCE is 8c/kg dwt sold.
Table 5. Effect of superior Dutch finisher FCE on Total feed cost. Source: Interpig
| Netherlands | Ireland | Diff | |
| Weaner Feed cost c/kg dwt | 16.5 | 33.2 | 16.7 |
| Finisher Feed cost c/kg dwt | 99.5 | 92.5 | -7* |
| Total weaner-finisher cost c/kg dwt | 116 | 125.7 | 9.7 |
| Effect of superior finisher FCE on total feed cost(9.7 – 1.74) c/kg | 8 |
* Irish finisher feed cost is lower due to our higher finisher start weight and lower sale weight.
Conclusion
Using a feeding strategy to chase maximum performance may not generate the greatest profit. Alternatively, a higher sow output and a change in our feeding philosophy by lower feed specifications in early life to benefit finisher stage FCE later, could reduce our feed cost by up to 14c/kg dwt sold and thereby make the Irish pig sector more cost competitive.
Read more from the Teagasc Pig Farmers’ Conference 2023