2025 calves bought in
- 100 calves bought
- Average price/head is higher than 2024
- CBV, breed & milk replacer details
As John’s herd is restricted with TB, he had to contact the DAFM for a permit to buy in dairy beef calves. So far he has 100 calves bought from 4 different farms and paid €200-215/head for them, and he plans to buy up to 130 in total. He has found that the average calf price is higher than last year as expected.
The calves are a mix of mainly Angus and Hereford crosses, with a few Aubrac and Limousin crosses included. The oldest calf was born on 31st January and the youngest was born on 18th March. There are 46 heifers and 54 bull calves. 61 calves are genotyped from being DNA registered on the farm where they were born, while only 39 are not genotyped. The average CBV is €82 which is an average of 3 stars within breed type. This is broken down as follows;
The desirable figures are to have a high star rating, carcass weight, carcass conformation and docility for the best performance. This is combined with a negative age at finish and feed intake.
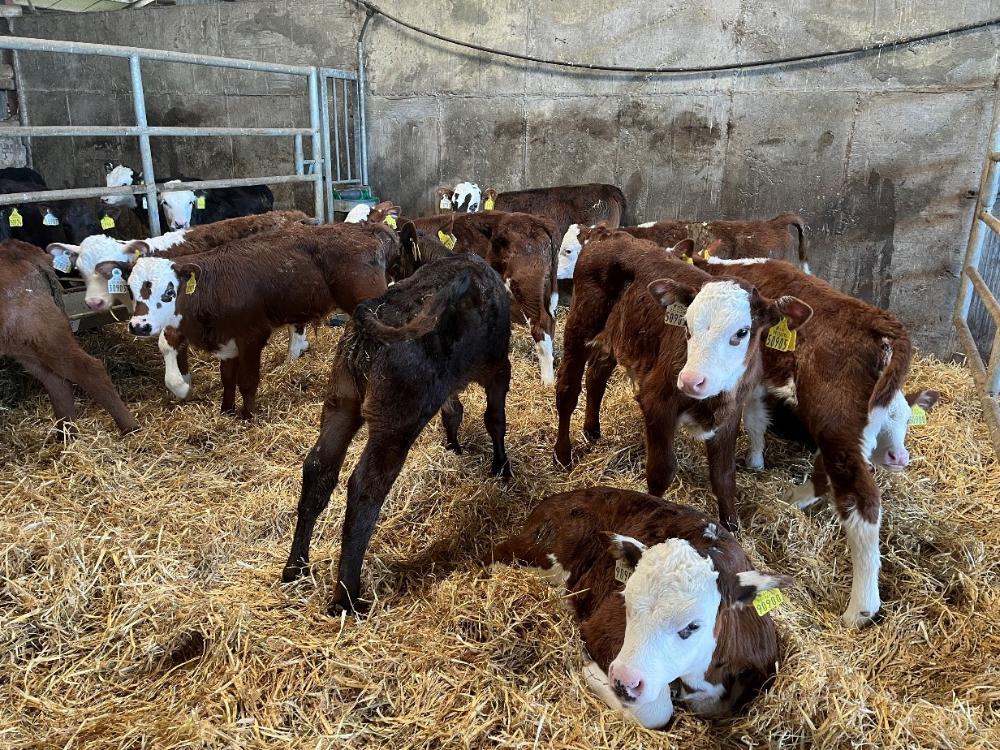
Figure 1: Pen of freshly bedded calves on the farm
The calves are being fed twice per day with a whey based milk replacer which is derived from the cheese making process. Whey based milk replacers are digested quicker by the calf which can help them start eating meal earlier. John is feeding this twice daily using the milk cart.
The label shows the following constituents of the milk powder:
They also have ad-lib access to an 18% crude protein ration and fresh water. John has access to hot water in the yard from a gas boiler which is located in the ‘kitchen’ area in a nearby shed.
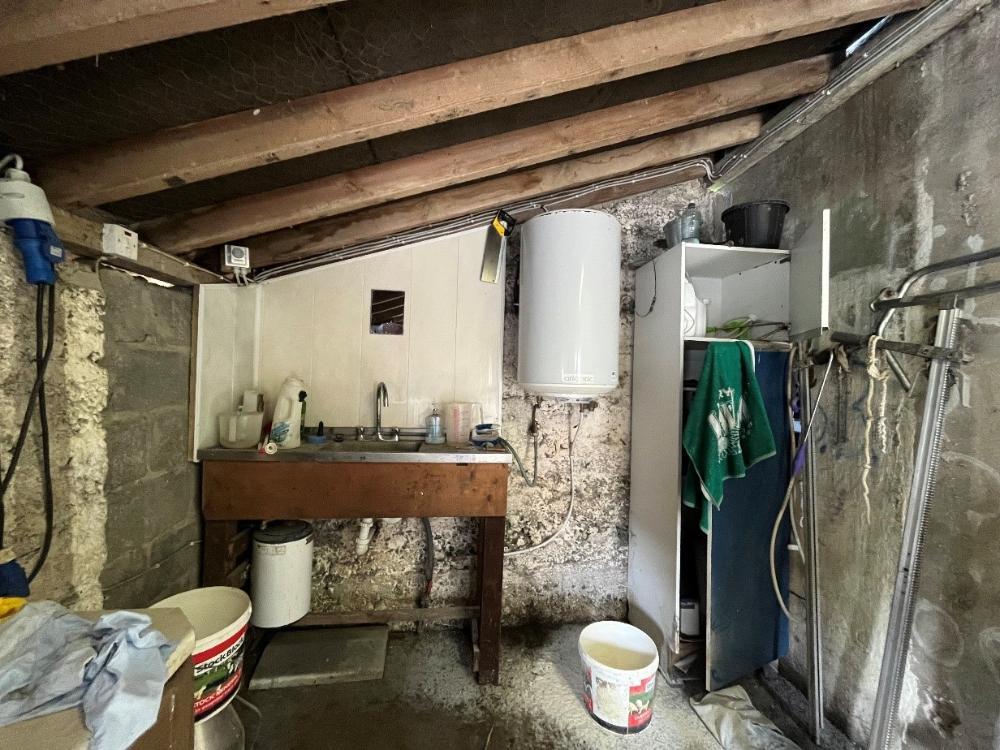
Figure 2: Kitchen area on John’s farm
The yearling and finishing cattle were weighed on 8th March on John’s farm. The 2024 suckler bullocks (37) averaged 293kg and gained 0.2 kg/day since 29th November. The 2024 suckler heifers (31) averaged 271kg and gained 0.29kg/day during the same time. This is below their target of 0.6 kg/day, despite feeding good quality silage which was balanced with ration, and having adequate lying and feeding space in the pens. It is suspected that there was an underlying fluke burden in them so they will be dosed for it.
The 2024 dairy beef cattle were outwintered and the bullocks (56) averaged 293kg, after gaining 0.36kg/day since 29th November. The heifers (60) averaged 284 kg and gained 0.46 kg/day in the same time.
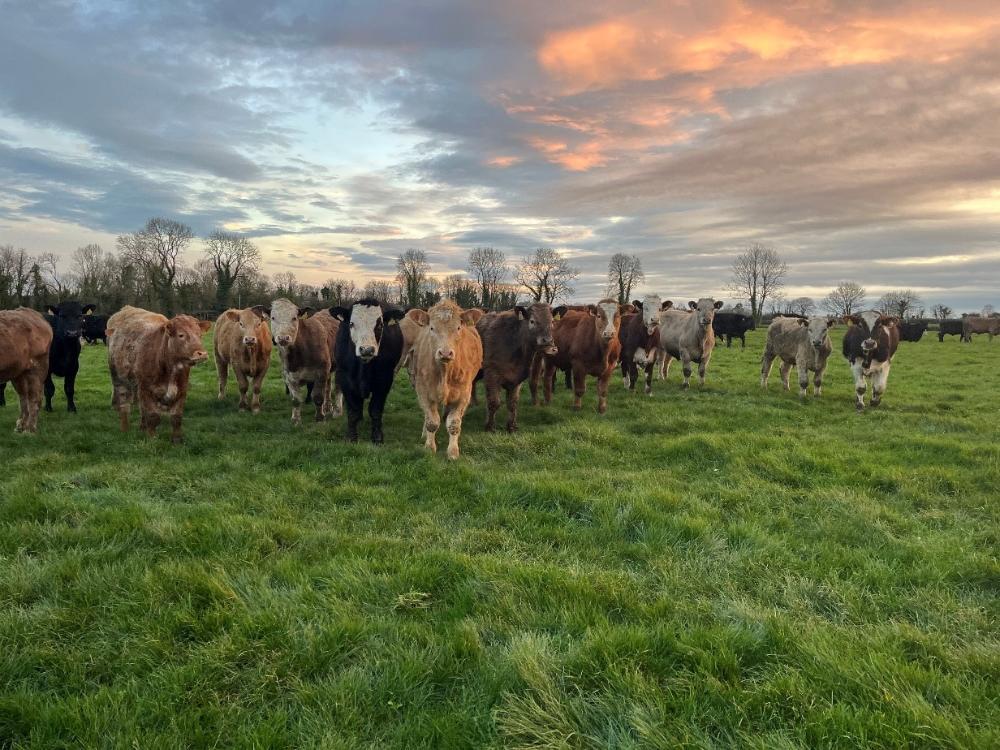
Figure 3: 2024 born bullocks at grass on the out farm in Rathfeston
The 2023 suckler bullocks (25) averaged 559kg on 8th March and gained 0.77 kg/day since 29th November. The 2023 suckler heifers (25) averaged 498kg and gained 0.58 kg/day during the same time.
The 2023 dairy beef bullocks (60) averaged 510kg on 8th March and gained 0.7kg/day from 29th November. The 2023 dairy beef heifers (10) averaged 429kg and gained 0.4 kg/day over the winter.
John is continuing to sell cattle to the factory as they come fit. They are currently eating 5.3kg ration/head/day but as the silage pit is getting smaller, John is considering increasing this to over 6kg/head/day.
18 dairy beef heifers and 16 dairy beef bullocks were sold from 12th March to 3rd April. The heifers averaged 236kg at 24.7 months of age and graded O-4-. They averaged €1713/head.
The bullocks averaged 289kg carcass weight at 26 months of age and graded O=3+. They were sold at a higher price and averaged €2260/head.
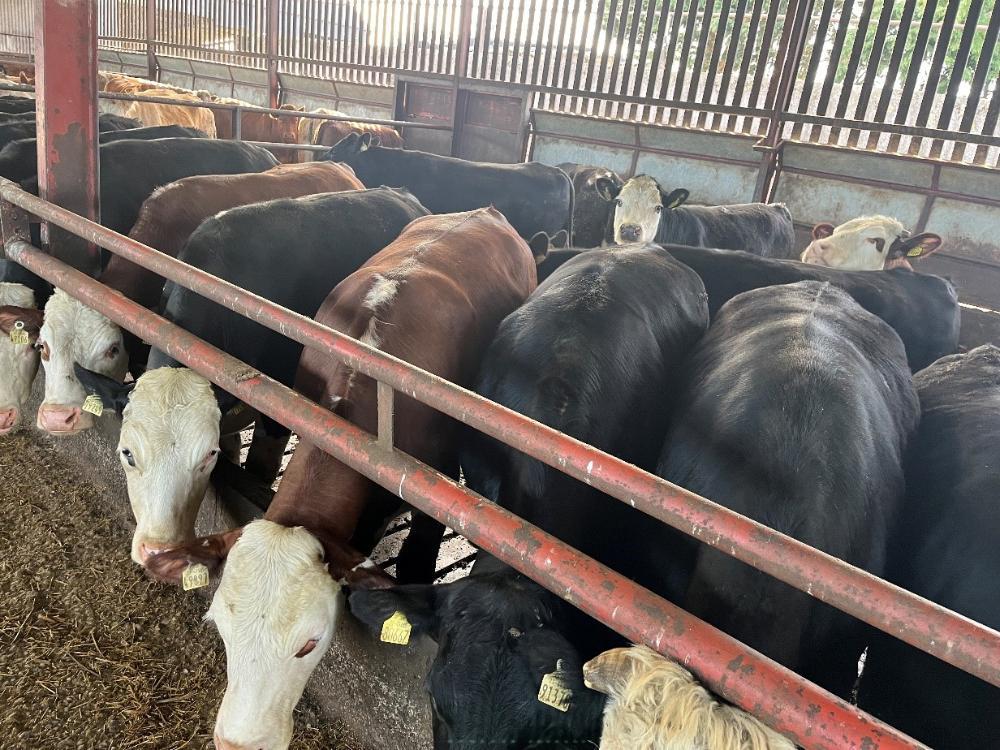
Figure 4: Dairy beef finishing cattle
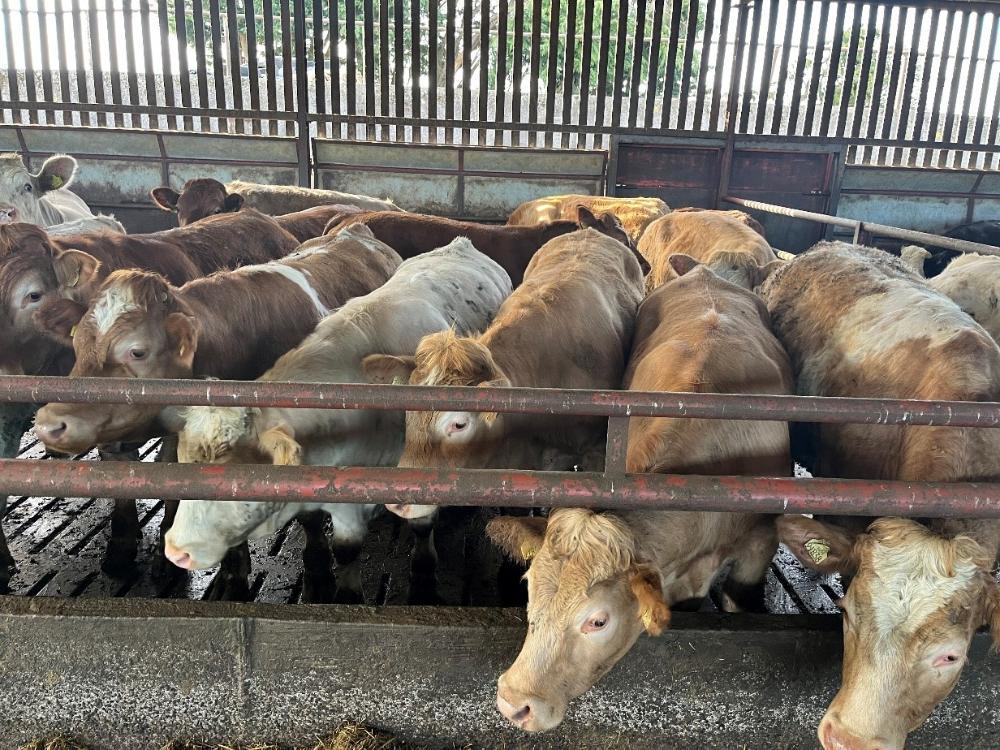
Figure 5: The suckler beef cattle are taking longer to finish
Local ASSAP advisor David Webster visited John’s farm in November 2024 and together they devised an application for the Farming for Water EIP. John is already carrying out some actions for water quality, such as implementing a buffer strip along the River Barrow on his farm which is over 1km long.
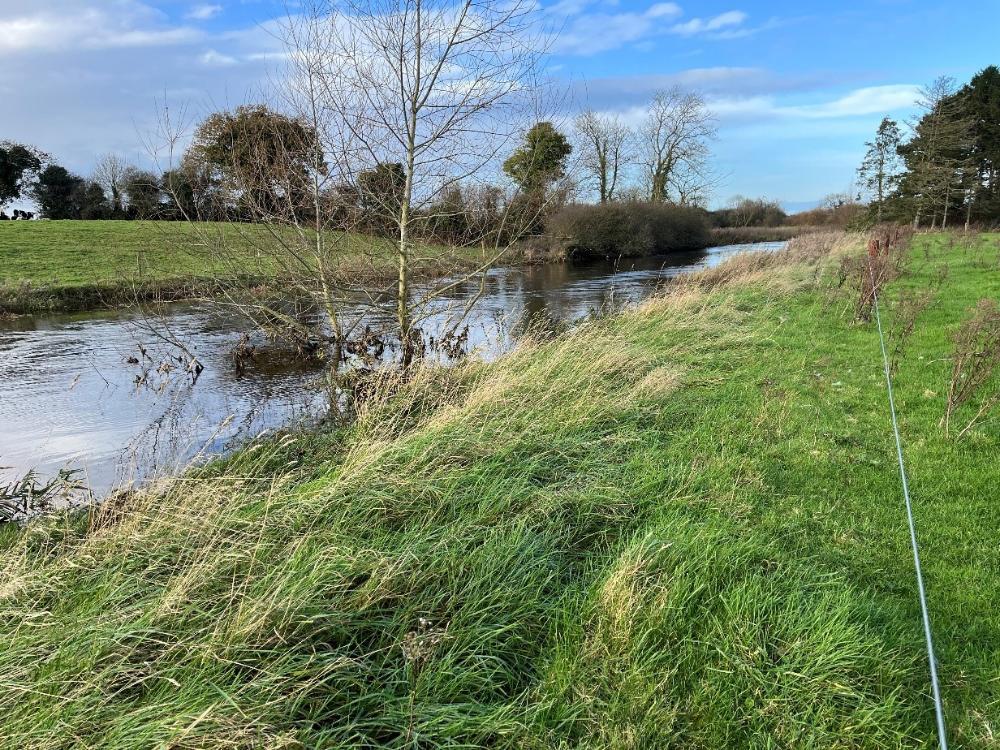
Figure 6: John fenced over 1km for a buffer strip between his land and the River Barrow
David walked the farm and recommended the following actions which have been submitted as part of the EIP application:
The EIP funds approximately 90% of the total cost of the actions and John has 1 year to complete them. He can also submit multiple payment claims throughout the year according as works are complete. The total approved cost in €22,849.23 based on the EIP reference costs.
The EIP is giving John an opportunity to implement water quality measures on his rented land as he has these in place on his owned land. The PIP map below shows his farmyard outlined in red and indicates the land that is prone to phosphorus loss in dark blue, which is mainly along the River Barrow. These maps are available on cathcments.ie and give good guidance on where the best places are to install water protection measures.
Further information on the Farming for Water EIP can be found here.
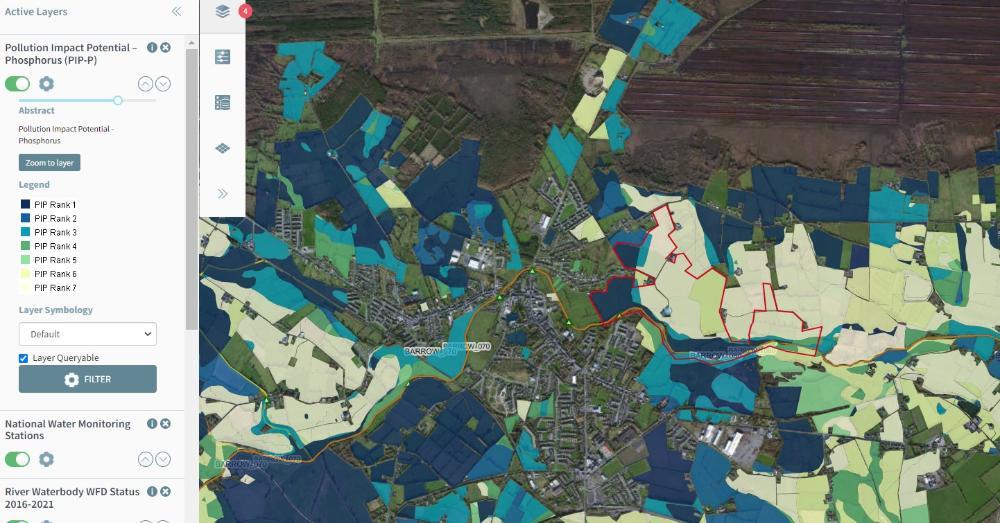
Figure 7: PIP(P) maps showing risk areas for phosphorus loss (Source: Catchments.ie)