Herd genetics
- Analysis of breeding reports
- Excellent terminal genetics in the herd
- Focus on improving milk and fertility
Calving is progressing well on the farm so far with 5 live calves on the ground.
Oliver has been looking at the genetics in the herd in regards to the bulls that will be used this season;
1. Cow genetics
The herd’s replacement index for cows is €97. The carcass weight is very high at 25kg, the daughter milk is low at 3.4kg, the daughter calving interval is poor at +0.57 days and the docility is average at 0.01.
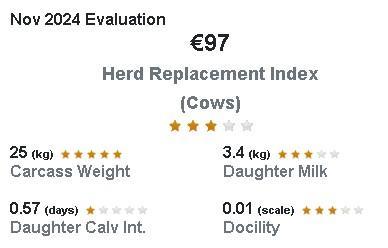
Figure 1: Eurostar details for Oliver’s cows
2. Calving performance
The ICBF beef calving performance report for 2024 shows the herd’s calving performance from 1st July 2023 to 30th June 2024. Calving started on 1st January and finished on 19th June last year, lasting 24 weeks in total with 31 cows calved.
The calving interval was 405 days which is higher than the target of 365 days, but the 5 recycled cows (16%) would have contributed to that. Mortality was very low at 0%, but Oliver acknowledges that it was high in 2023 so it doesn’t always happen! The calves per cow per year were 0.9 and no heifers calved between 22-26 months of age. The spring 6 week calving rate was 17%.
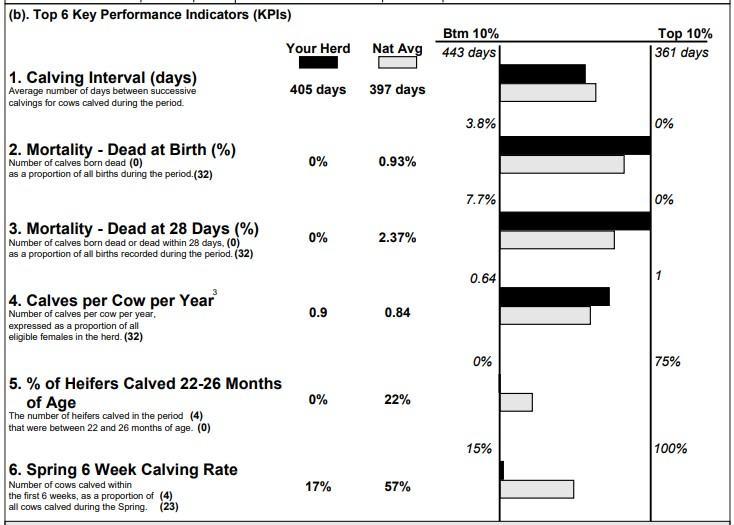
Figure 2: ICBF calving performance report 2024
3. Calf performance
The weaning performance report for 2024 shows that the calves born were well ahead of target. The bulls (15) averaged 319kg at 200 days of age, which is above the target of 300kg, gaining 1.37kg/day on average. The heifers (16) averaged 279kg at the same age, which is above the target of 250kg and gained 1.18 kg/day on average which is very good.
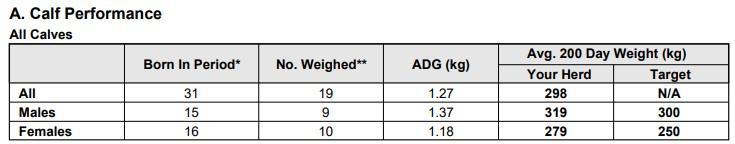
Figure 3: ICBF weaning performance report 2024
4. Breeding trends
The 5 year trend report for the herd shows that the replacement index for the cows and heifers is increasing. The calving interval has dis-improved from 381 days in 2020 to 405 days in 2024. The calves per cow per year has also reduced as a result from 0.93 to 0.87. Very high heifers calve on the farm at 22-26 months of age and the spring 6 weeks calving rate has improved slightly from 5% to 17%.
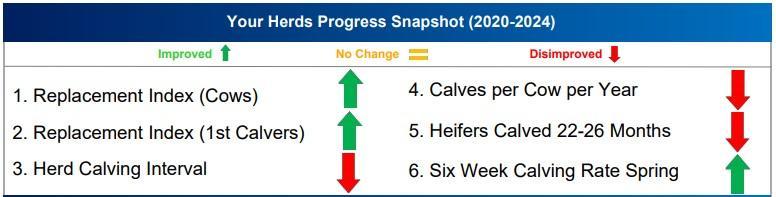
Figure 4: 5 year trend report summary
5. Summary
From examining the herd’s breeding performance, it shows priorities for the breeding season:
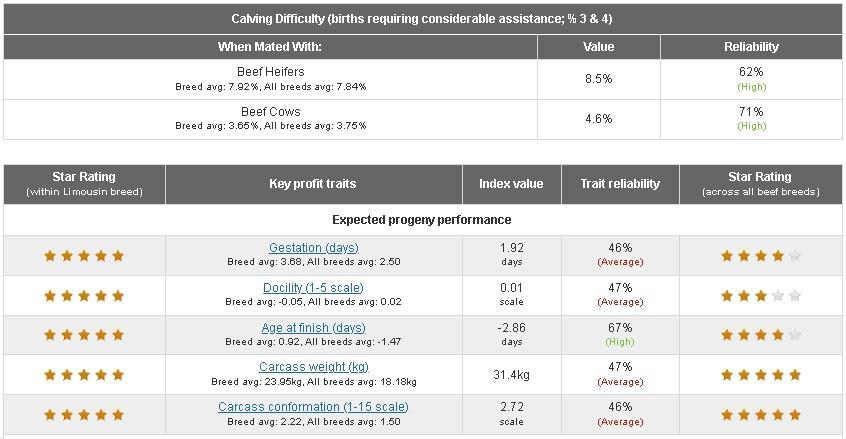
Figure 5: Stock bull genetic traits (Source: ICBF)
Oliver sold 2 of his bulls in the mart on 3rd February. One bull was a Charolais/Limousin cross sired by Gamin and born in January 2024. He was sold for €2400.
A second bull was a Limousin/Belgian Blue cross sired by Loyal that was born in March 2024. He made €2040.
Two cows were also sold this month.
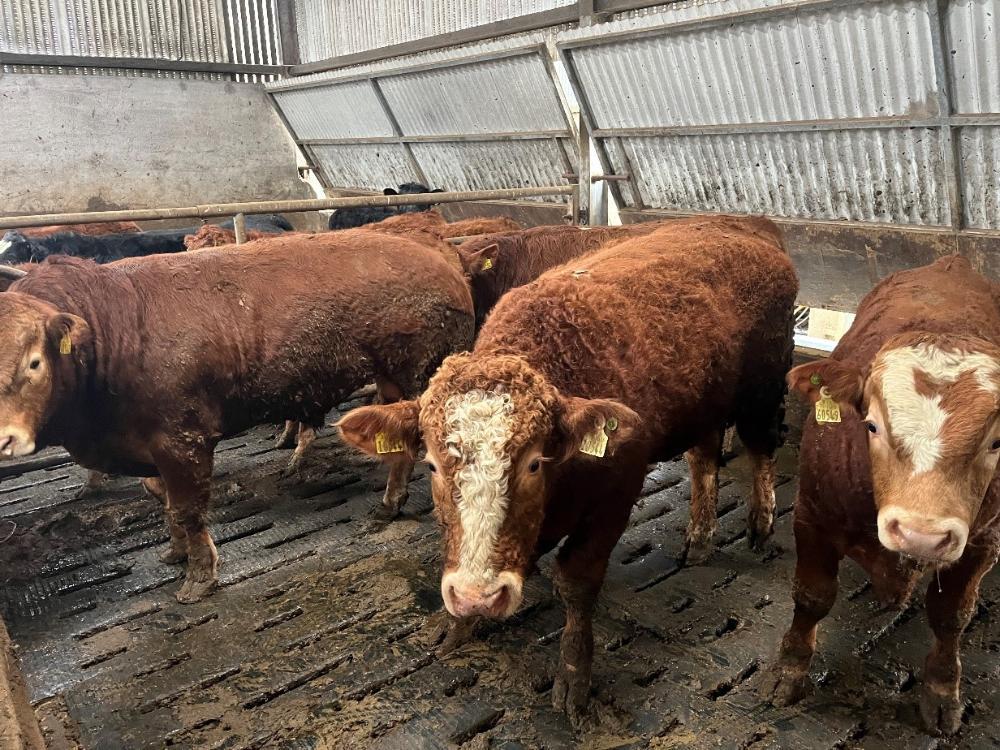
Figure 6: Some the remaining bulls that were born in 2024. They’re eating 6.4kg ration/head/day.
Oliver has completed his profit monitor for 2024. He is farming with his wife Christine and they are operating a sheep and suckler beef enterprise. Focusing on the cattle detailed report, he has been analysing the farm’s financial and physical performance this year.
The first figure on the report is the output per livestock unit which was 291 kg/LU. This was a decrease since 2023 where the figure was 335 kg/LU, and is behind the target >350 kg/LU for a suckler system. This figure is affected by everything that affects weight gain in the herd – the cow fertility, bull fertility, mortality, genetics, nutrition at grass, winter performance, ration fed, animal health and calving spread. Mortality wasn’t high on the farm in 2024 but a difficult year with weather conditions, an extended calving interval of 405 days and 5 recycled cows kept last year is pulling his figure down. The cattle were also sold younger which meant they were lighter at sale, despite the higher sales price per kg and this would have impacted the output/LU.
The stocking rate on the farm is 1.69 LU/ha or 117 kg organic N/ha which is as high as Oliver plans to go. He is restricted by land type and housing available, although he is considering increasing the ewe numbers.
The gross output figure is calculated from cattle sales minus cattle purchases and add/subtract any changes to the inventory. Oliver had a gross output figure of €1590/ha which is the main ‘money in the pot’ to cover variable and fixed costs. This decreased by 12% from €1785/ha in 2023.
The 3 biggest expenses on drystock farms are purchased concentrate, fertiliser and contractor costs. Oliver’s farm is no different with his biggest costs for the year;
In total, the total variable costs (€786/ha) were 49% of the gross output figure, which is on the target of <50% for a suckling system. It is well back on 2023 where it was 61% – mainly due to higher feed costs and a lower price per kg per animal sold.
The fixed costs were €853/ha for 2024 which is similar to 2023, with the land lease cost making up the biggest percentage of these.