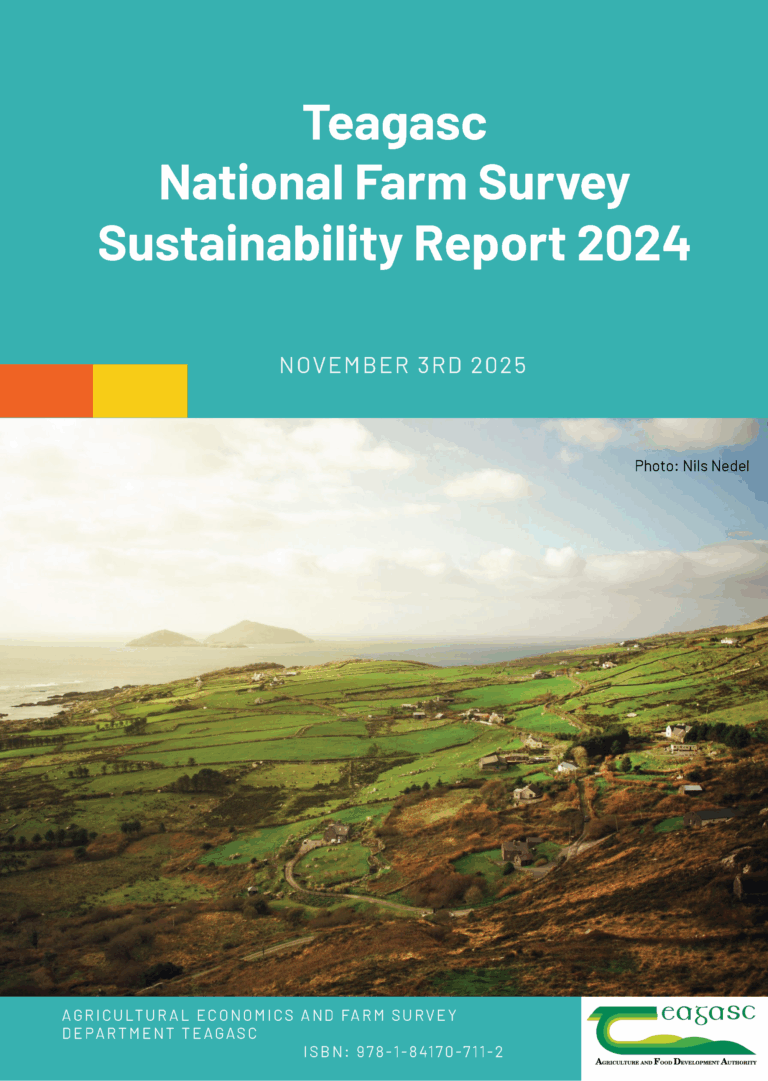
National Farm Survey – Sustainability Report 2024
This report provides the latest available information on the sustainability performance of farms in Ireland, based on detailed analysis of data collected through the Teagasc National Farm Survey.
By Cathal Buckley and Trevor Donnellan, Teagasc
Download Publication (PDF)
Economic, Social, Environmental and Innovation sustainability metrics are produced for Dairy, Cattle, Sheep and Tillage farms in 2024. The report also includes time series results over several years, which allows an assessment of how farm sustainability has changed temporally.
Launch of the 2024 Sustainability Report Webinar
The Teagasc Sustainability Report 2024 was launched during a webinar on Monday, 3 November 2025. The webinar reported on the economic, social & environmental metrics, using representative data from the Teagasc National Farm Survey. The online webinar also detailed new developments on sustainability reporting developed through the Teagasc National Farm Survey including fertiliser use and food security provision across a range of farm systems.
Watch the webinar recording below
National Farm Survey Sustainability Dashboard
Teagasc has launched a National Farm Survey (NFS) Sustainability Dashboard, which provides the latest available information on the sustainability performance of farms in Ireland, based on detailed analysis of data collected through the Teagasc NFS. The dashboard also includes time series results over several years, which allows an assessment of how farm sustainability has changed temporally.
View the Sustainability Dashboard here
Economic sustainability
- After a very challenging year in 2023 the economic sustainability metrics recovered strongly in 2024 across all farm systems. With the exception of 2022 (which was a significant positive outlier) gross output, gross margin and income per labour unit in 2024 was the highest since the report was first published across dairy, cattle and sheep farms.
- The strong recovery in incomes led to higher levels of economic viability (return the minimum wage for labour employed and a 5% return on non-land based assets). Across all the years in which the Sustainability Report has been published, the percentage of viable farms in 2024 was at a record high for cattle (30%) and sheep systems (41%).
- As per the long-term trend, Dairy remains the economic powerhouse, with economic returns tending to be multiples of the other systems.
Social sustainability
- With higher economic returns in 2024, household vulnerability (economically viable from agricultural activities or has off-farm employment) levels were lower across all farm systems.
- Also, as per the long-term trend, Dairying continues to exhibit stronger social sustainability relative to other farm systems, especially compared to drystock. Dairy has lower household vulnerability, a lower share of households with a high age profile and a lower prevalence of isolation risk than in the case of the drystock systems.
- However, the main dairy farm operator continues to work more hours than the farm operator in other farm systems (an additional 400 hours per annum) – even when time spent in off-farm work is included for all farm systems.
- An additional food security related variable has been added to this year’s report. It is based on protein generated on a per hectare basis across the different farm systems. There are two definitions: gross (protein in products sold) and net (protein in products sold less human edible protein fed to livestock). Results indicate dairying on average generates enough protein per hectare to meet the yearly requirement of 17 and 20 people (net and gross respectively), while the figure for tillage is not far behind at 14 (net) and 15 (gross). Figures for the more extensive drystock systems are lower, at 4 (net) and 5 (gross) for cattle and 3 (net) and 4 (gross) for sheep systems.
Environmental sustainability
Greenhouse gas emissions
- Dairy: Absolute GHG emissions on a per farm and per hectare basis declined on dairy farms in 2024. Although chemical N fertiliser application rates increased, this was more than offset by a decrease in overall livestock numbers on dairy farms (although the dairy cow herd size was static). Milk related emissions were hence static (milk output per cow also static), consequently IPCC based GHG emissions per kg FPCM were static. Per hectare emissions were also affected by increasing farm size which contributed to a reduction in per hectare GHG based emissions.
- Non-Dairy Systems: Farm level GHG emissions on cattle, sheep and tillage farms also declined somewhat in 2024. This was driven by reduced livestock numbers (cattle and sheep) and reduced chemical N fertiliser use (tillage farms). Per hectare emissions were static, except for cattle farms which declined slightly.
Ammonia emissions
- On dairy farms, ammonia emissions per farm and per hectare declined in 2024. Although fertiliser application rates increased, 40% of total chemical N applied was in the form of protected urea. Lower overall livestock numbers were present, Dairy cows also spent more days at grass in 2024 and LESS equipment was used for 85% of the slurry applied.
- Ammonia emissions in other farm system also tended to decline in 2024 mainly due to lower livestock numbers, more grazing days and increased adoption of technologies like LESS.
Nitrogen balance and use efficiency
- Across all livestock systems, N surpluses increased and use efficiencies declined in 2024 compared to the previous years on foot of increase rates of chemical N application and higher rates of concentrate use, while output was relatively static. Due to the more intensive nature of production N surpluses were significantly higher on dairy farms versus all other systems.
- The reverse was the case across tillage farms, mainly driven by slightly reduced chemical N inputs.
Innovation
- The transition towards the use of LESS equipment for slurry application continued in 2024. In total, 85% of slurry on the average dairy farm and 45% on the slurry on the average cattle farm was applied via LESS.
- The percentage of total chemical N applied in the form of protected urea is growing on dairy farms and reached 40% in 2024. This upward trend is also evident on cattle and sheep farms, but remains at a relatively low level in absolute terms,
