May – Distribution of Cultivated Peats
Cartographer: Dr Stuart Green
View map: Distribution of Cultivated Peats
In this months map we look at the distribution of cultivated peat soils. Whilst peat-lands which include raised bogs and blanket bogs and fens, cover upwards of a fifth of the country, their use can be limited because they are generally very wet in the un-drained state. The extraction of peat for fuel, either mechanically or by hand is a principal use of these soils but this is drawing to a close as the climate impacts of draining and burning peats are now clear. In their natural state peats are natural sinks of carbon and are the largest reservoir of stored carbon in the Irish landscape. The remaining bogs are seen as vital parts of Irish biodiversity and so are no longer planted with forestry which has traditionally been a significant land use of peat soils. The blanket bogs cover much of the commonage areas in the country and are thus used for (and indeed maintained by) rough grazing of sheep.
However not all peat soils are bogs, a significant portion of peat soils have been used and adapted over the decades through drainage and fertilization for grass (and to a much smaller extent cereal) production. These grasslands over peats are no longer bogs in an environmental sense but they are primarily organic soils and would revert back to a natural vegetative state were it not for continuous management through drainage, grazing and fertilizing/liming.
Irish research has shown that this sort of management of organic soils, especially drainage, turns these natural stores of carbon into emitters of carbon so in order to get the correct accounts of emissions and sequestrations of land use it’s vital that we know where these cultivated organic peat soils are.
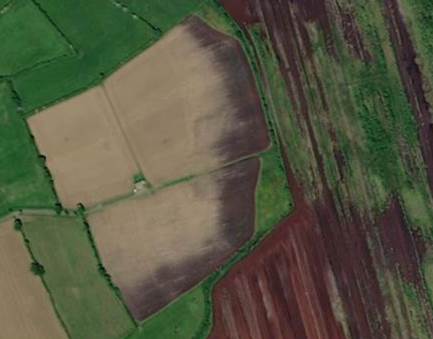
To map the distribution we used the peat soils in Teagasc Indicative Soil map, along with field boundaries mapped in the OSI National Digital Map database and parcel information in LPIS. This allowed us to identify fields, currently farmed, that overlay peat soils. The image here gives an example of 3 bare fields with a mix of soils with the darker peat soils to the right.
We excluded non-farmed bogs, commonage areas, forested areas and worked bogs (peats extracted for fuel).
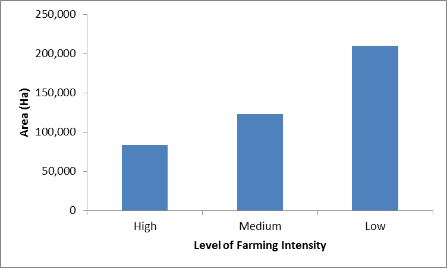
To get a sense of how heavily managed and thus how productive the fields are we looked at satellite imagery for 2018 (a drought year, but one in which peat soils and poorly drained mineral soils performed well because of their moisture content). Using a method of analysis called vegetation indexes we can use the satellites to score fields between 0 and 1, with a higher score meaning more biomass production. We banded the fields into 3 bins; Low, Medium and High based on these indexes to give a crude indication of the level of production.
Whilst the analysis is done at field scale, the map is presented at 1km square scale- each 1km cell is coded for the percentage of cultivated peats in the cell and whether they are mainly high, medium or low production. We have omitted cells with less than 30% cultivated peats to make the distribution clearer and not to give a false impression of the true areal extent of cultivated peats.
This analysis suggests approximately 6% of the country or 420,000Ha is made up of cultivated peats across a wide range of farming intensities (though predominately low intensity farming).