06 September 2024
Is your crude protein costing you?
Kieran Keane writes about variations in crude protein content, which can substantially impact diet formulation costs and effectiveness.
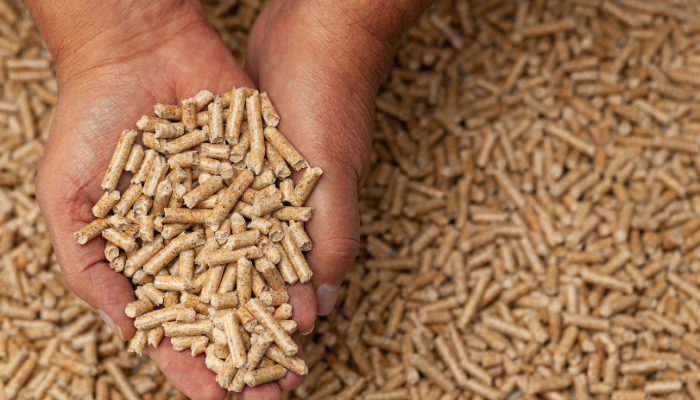
The pilot Feed Nutrition Lab at Moorepark has been operational for the last number of months. During this time we have been sourcing feed ingredients samples from a number of nearby farms for analysis. So far we have concentrated on the main bulk feed ingredients such as wheat, barley, soya and maize and most of our wet chemistry results have been on crude protein (CP) content of these raw ingredients. Table 1 below shows the results of over 500 samples.
Table 1: Crude protein results from wet chemistry analysis.
| FormulationCP | AverageCP | Highest10% CP | Lowest10% CP | |
| Barley | 10.00% | 9.87% | 11.22% | 9.21% |
| Wheat | 10.50% | 10.50% | 11.60% | 9.33% |
| Soya | 47.20% | 46.78% | 47.50% | 45.71% |
| Maize | 8.15% | 7.30% | 7.97% | 6.80% |
The Formulation CP percentages are the crude protein values for these ingredients that we would normally use to formulate diets. The Average CP percentages are the average crude protein values across all samples of that analysed ingredient. The Highest 10% CP percentages are the averages of the highest 10% of results and the Lowest 10% CP is the averages across the lowest 10% of results. As you can see there is considerable variation. However it’s important to preface these results by highlighting that they are from a relatively short period of time and are subsamples taken from the farmer’s own spot samples.
To demonstrate the difference these values make during diet formulation please see the Moorepark Finisher diet below. This diet is formulated using the Formulation CP values from Table 1 and comes in at an ingredient cost of €281.18/t and 16% dietary crude protein.
Table 2: Moorepark finisher diet.
| Ingredient | Inclusion Kg/t |
| Barley | 572.10 |
| Wheat | 249.20 |
| Soya Hi-Pro | 145.50 |
| Limestone flour | 10.95 |
| Fat, soya oil | 9.00 |
| Lysine | 4.68 |
| Salt feed grade | 3.00 |
| L-Threonine | 2.03 |
| DL-Methionine | 1.23 |
| Vit-Min Mpk Finisher | 1.27 |
| MCP (22.7% P & 16%Ca) | 0.96 |
| L-Tryptophan | 0.03 |
| Ronozyme HiPhos GT | 0.05 |
| 1000.00 | |
| Price | € 281.18 |
| Crude Protein | 16% |
However, if we use the Average CP column from table 1 this diet now comes out at 15.82% crude protein, 16.96% for the Highest 10% CP column and a 14.99% with the Lowest 10% CP column. So in summary there’s about a 2% swing in crude protein between the highest and lowest values used. That is a substantial difference in crude protein not to mention the effects on amino acid ratios. While it is overly simplistic to suggest that you would have either all the lowest or all the highest value ingredients in your silos at the same time, I have shown the extremes to highlight the potential financial implications. Smaller differences and imbalances could still be costing a lot in either underperformance of the animals, or oversupply of protein in a diet that could have been made cheaper.
However, if you know the CP content of what you have in your silos you could reformulate accordingly to correct for these differences. To tweak the diet above to get back to 16% CP and a balanced amino acid profile: The ingredients with the Average CP values would cost €281.74/t, the Highest 10% CP figures would give a cost of €279.84/t and the Lowest 10% CP figures would end up costing €284.16/t. The difference between the highest and lowest figures would translate to over €18,000 per year on finisher feed on an average 700 sow herd. As this is based on crude protein, then the higher the price of soya, the greater the cost differential of the diets.
Again this is slightly simplistic as all ingredients above have been allowed to change when in practice a lot of the lower inclusion ingredients would already be blended into a premix. In fact if all ingredients from lysine down on the recipe in Table 2 are left unchanged there will still be a price difference when using the Highest 10% or Lowest 10% values (€280.51 vs €283.66) but the dietary crude protein will not return to 16%. It would be 16.66% for the Highest 10% CP values and 15.36% for the Lowest 10% CP values. So we can get nearer to our targets but not quite hit them. The practicalities of dealing with varying qualities of ingredients on farm may just come down to being able to separate different loads and using them accordingly.
After all we can only ‘manage what we can measure’ and at the moment we simply don’t know what the quality of each ingredient on each truck is. While it is our hope to be able to roll out more testing in the feed lab we are not quite there yet. Your supplier of feed ingredients should be able to provide you with some of this data on request as they will have results on file for various tests carried out particularly on imported ingredients. While the examples above highlight the cost differences of manipulating diets when values are known, the hidden cost differences in the unknown could have much more impact on your bottom line.