The uncertainty around trade restrictions, increased labour demand, pressure on housing and feed, and the mental toll of a bovine tuberculosis (bTB) breakdown all add up to significant stress for farmers.
Traditional control measures like testing, culling, and biosecurity remain essential. However, as Dr. Siobhán Ring, ICBF, and Professor Donagh Berry explain, genetic improvement provides a sustainable, long-term strategy that complements these efforts.
Potential of breeding for bovine TB resistance
Some animals are born with a naturally stronger ability to resist bTB infection – this is what is meant by genetic resistance. In Ireland, genetic differences between animals account for approximately 12% of the variation in susceptibility to bovine tuberculosis (bTB) within a herd. To put into perspective, 35% of the differences in milk yield within a herd are due to genetic differences while genetic differences account for 3% to 5% of the variability in whether or not a cow will succumb to lameness or mastitis.
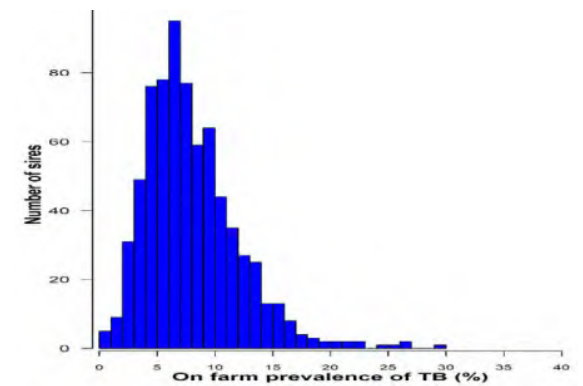
Figure 1: Distribution of sires based on the prevalence of bTB among their daughters
ICBF genetic evaluations now exist for individual bulls and cows on their resistance to bTB. Just like what Irish dairy farmers have been doing for decades by selecting bulls that are expected to produce more fertile and productive daughters, farmers can therefore now select bulls who are more likely to produce daughters that are more resistant to bTB.
Importantly, only data from herds with confirmed bTB breakdowns are used to generate the bTB breeding values. At least two standard reactors diagnosed by the skin test or a confirmed slaughterhouse case are required for a herd to be considered exposed.
Figure 1 demonstrates the variability among sires in what percentage of their daughters were recorded as reactors; each sire had to have at least 10 progeny in at least five herds. Reactor rates for some sires were as high as 30%, while others in the same herds had rates below 5%.
But does it actually work?
To test the validity of the genetic evaluations for bTB, a genetic evaluation from the past is used to estimate genetic predisposition to bTB of animals born in a given year. These animals are then followed throughout their life and whether or not they succumb to bTB (in locked up herds) deduced.
Table 1 summarises the results where the animals were categorised based on their ICBF genetic merit for resistance to TB (i.e. predicted transmitting ability; PTA).
Table 1. Prevalence of bTB in 15,000 dairy cattle between the years 2021 and 2022 when categorised based on their genetic resistance to bTB
| bTB genetic group | Mean bTB PTA | Mean bTB prevalence |
| Best resistance to bTB | 6.5% | 10.4% |
| Good resistance to bTB | 7.2% | 10.6% |
| Average resistance to bTB | 7.5% | 10.6% |
| Poor resistance to bTB | 8.0% | 11.5% |
| Worst resistance to bTB | 8.8% | 12.4% |
Analyses of bTB skin test and slaughterhouse data for 15,000 dairy cattle between 2021 and 2022 show that cattle classified as genetically more resistant to bTB had, on average, at least 20% fewer reactors than those considered less resistant.
As part of the Moorepark 2025 Open Day, Professor Donagh Berry discussed the impact of breeding for bTB resistance, find out more in the below video:
How to use bTB resistance breeding values in your herd
Even if a herd has never had a bTB breakdown, all animals will still have a bTB genetic resistance score. That is because of widespread use of AI and robust parentage recording; many animals are therefore genetically related, so the sharing of genes enables the prediction of a genetic risk score to bTB.
Genomics improves the precision of the predictions of bTB risk. Bovine tuberculosis resistance is now a trait within both the Economic Breeding Index (EBI) and Dairy Beef Index (DBI), accounting for ~3% of emphasis within each.
Like with any trait, it is the prerogative of individuals to place greater selection pressure on individual traits within these indexes – if in a region with a history of bTB, then greater selection pressure may be placed on bulls with favourable genetic merit for bTB (i.e. low PTAs). Alternatively, farmers can avoid using bulls with poor PTA for bTB.
The bTB resistance PTA value predicts the percentage of progeny likely to become bTB reactors if the herd succumbs to a bTB breakdown. The bTB resistance PTA value typically ranges from 1 to 14% with the average value being 8%. This value of 8% means, on average, 8% of a bull’s progeny are likely to go down with bTB should the herd suffer a breakdown. Therefore, bulls with lower bTB resistance values are preferable.
To make things easier, a traffic light system is now in place:
- Green = good to go, genetically most resistant to bTB
- Orange = proceed with caution, moderate resistance to bTB
- Red = avoid, genetically least resistant to bTB
Breeding companies actively promote bulls with strong bTB resistance. Both high- and low-resistance sires exist with high EBI values, therefore it pays to check this trait when selecting bulls.
Conclusion
While breeding for bTB resistance will not eliminate the disease overnight, over time, it can play a powerful role in reducing the risk of breakdowns – the evidence for genetic selection improving herd performance has been well documented.
The above article first appeared in the Moorepark 2025 Dairy Open Day book, which is available here.