As part of the recent Teagasc National Dairy Conference, Joe Patton and Laurence Shalloo examined the trends in cost of production over time, and the key associations and relationships that should be prioritised at farm level to control costs.
The Irish dairy industry has undergone a remarkable transformation since the removal of EU milk quotas in 2015. Since preparation for their removal began in the 2007 – 2009 period, and up to 2022, milk solids output increased by over 96%. While there was a reduction in output between 2022 and 2023, milk solids output increased by 1% in 2024. This increased output has been achieved through increased cow numbers, increased milk yield per cow, increased fat and protein percentages, increased stocking rate, and additional land entering the dairy industry.
While it is clear the dairy industry still has great potential to both grow and improve efficiency, it is important farmers remain focused on their system to create a resilient and profitable long-term business. As grass silage and concentrate are 3 to 5 times more expensive than grazed grass, focusing on maximizing the proportion of grazed grass in the diet of the dairy cow has resulted in profitable dairy systems.
However, since 2020 production costs have increased due to external factors such as the Covid pandemic and the Ukraine war. This has been compounded by incremental increases in level of purchased concentrate feed use at farm level for no change in productivity, displacing grazed grass in the diet.
The industry must navigate challenging conditions brought about by changing environmental policies, system creep, variable pasture production, increased reliance on concentrate supplementation, and an economy operating at full employment, all amid ongoing uncertainty in policy and trade conditions. This paper will describe the cost changes over time at farm level and the key associations and relationships that should be prioritised at farm level to control costs.
Trends in cost of production over time
Over the past number of years, there has been significant change in costs of production at farm level when expressed in costs per kg of milk solids (Figure 1). Between 2012 and 2020, there was relative stability in costs per kg of milk solids. However, since 2020, there has been a dramatic increase in costs of production driven mainly by factors outside the farm gate but also associated with changes within the farm gate. The increase in costs in 2022 was largely driven by the geo-political situation related to the war in Ukraine and was associated with input price inflation rather than on system change or system creep. Since 2022 there has been a significant retrenchment in input prices, yet this has not been directly associated with a reduction in costs.
The ‘sticky’ nature of the costs of production reflected two difficult weather years as seen in 2023 and 2024. The National Farm Survey (NFS) data shows that costs of production are dropping since 2023 albeit slowly. The NFS estimates for 2025 are based on the best information available, without the final quarter of 2025 being available. It is possible when the full information is available for 2025 that costs may have dropped to a greater extent.
Figure 1. Change in costs of production on Irish dairy farms between 2012 – 2024 (calculations based on NFS)
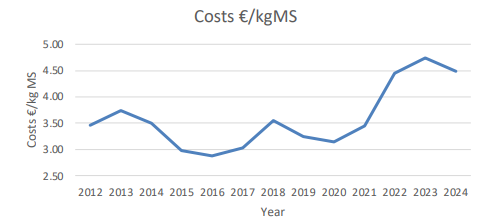
The reality is with this level of cost increase that dairy farmer income would be under significant pressure if not associated with dramatic increases in milk price over the period from 2021 to 2025. The milk price increase observed in 2022 and again at the later end of 2024 and into 2025 has reduced some of the exposure of some dairy businesses to the dramatic cost increases (Figure 1).
In reality, there is an urgent need to reduce costs of production to reduce the exposure of dairy farms in 2026. Family farm income was under €50,000 in 2023, which was the only year since 2012 where the family farm income was actually below €60,000, and this created significant income and cash-flow pressures on dairy farms. The impact was compounded and cushioned by the high income observed in 2022 (circa €150,000).
Currently it appears that 2025 into 2026 is showing similar trends as were observed in 2022 into 2023 with one key exception being the value of beef which will put a floor under both calf and cull cow prices with projections suggesting that beef markets will remain stable in 2026. There is a key requirement for all dairy farmers to now start planning for 2026 by creating a cash buffer, completing a cash flow budget and discussing with your financial institution if there is an expectation of a budgetary problem in 2026.
Factors driving cost change over time
Table 1 shows the overall summary financial figures for dairy farms over the period 2020 to 2025 in euros per kg of milk solids. Between 2020 and 2025 variable costs increased by 46% per kg of milk solids while fixed costs have increased by 28%. Total costs have increased from €3.13 per kg MS in 2020 to €4.49 per kg MS in 2024 or a 43% increase, with that figure being 51% in 2023.
Table 1: Gross output, costs and net margin per kg milk solids for the years 2020 to 2025
| 2020 | 2021 | 2022 | 2023 | 2024 | |
| Gross output | 4.62 | 5.26 | 7.83 | 5.63 | 6.51 |
| Direct costs | 1.79 | 1.90 | 2.57 | 2.74 | 2.62 |
| Gross margin | 2.83 | 3.35 | 5.26 | 2.89 | 3.89 |
| Overhead costs | 1.34 | 1.54 | 2.09 | 1.97 | 1.87 |
| Total costs | 3.13 | 3.44 | 4.66 | 4.71 | 4.49 |
| Net margin | 1.48 | 1.81 | 3.17 | 0.92 | 2.20 |
Source: Calculations based on the NFS
Table 2 shows a breakdown in cost changes between 2020 and 2024. It shows that pasture and forage costs increased by €0.24 per kg MS while concentrate costs increased by €0.38 per kg MS. The concentrate cost increase reflects a 52% increase in concentrate costs while the pasture and forage cost increase reflects a 47% increase between 2020 and 2024. In terms of overhead costs, energy and fuel increased by €0.12 per kg MS, hired labour by €0.05 per kg MS, rent by €0.05 per kg MS, machinery depreciation by €0.12 per kg MS and building depreciation by €0.05 per kg of MS.
Based on the NFS data, of the total increased costs at farm level increased pasture and forage costs accounted for 18% and concentrate cost 28%, In terms of fixed costs energy and fuel reflects 10%, hired labour 4%, rent 4%, machinery depreciation 9%, building depreciation 4%. Pasture and forage costs, concentrate costs, energy and fuel, hired labour, rent, machinery depreciation and building depreciation accounted for 78% of the cost increases.
Table 2: Breakdown of cost increases over the period 2020 to 2024
| 2020 | 2021 | 2022 | 2023 | 2024 | |
| Direct costs | |||||
| Pasture and forage | 0.59 | 0.57 | 0.85 | 0.89 | 0.83 |
| Concentrate | 0.73 | 0.82 | 1.13 | 1.17 | 1.11 |
| Overhead costs | |||||
| Energy and fuel | 0.26 | 0.30 | 0.40 | 0.39 | 0.38 |
| Hired labour | 0.08 | 0.09 | 0.13 | 0.13 | 0.13 |
| Rent | 0.14 | 0.14 | 0.17 | 0.16 | 0.19 |
| Machinery depreciation | 0.21 | 0.26 | 0.40 | 0.41 | 0.33 |
| Building depreciation | 0.15 | 0.22 | 0.35 | 0.26 | 0.20 |
Analysis of factors driving dairy farm profitability
National Farm Survey data provides a highly representative picture of trends in average costs and margins for dairy farms across years. In addition to but separate from NFS, Teagasc also collates detailed physical and financial benchmarking data from approximately 1,200 dairy farmers annually through the E-Profit Monitor system (ePM). These farms are primarily members of Teagasc discussion groups, are larger in scale than the NFS average, and participate on a voluntary basis.
For these reasons the ePM data should not be interpreted as representative of ‘national average’ performance. However, given the detail and quality of data collected, and the significant range in farm performance observed within a given year, it is very useful as means to explore the underlying causes of farm-to-farm variation in costs and profit. In this way the most relevant physical performance metrics can be identified. The analysis presented looks at the key factors of grass utilisation, concentrate feeding levels, herd milk productivity, and cost control, and how they relate to overall profitability.
Grass utilisation metric
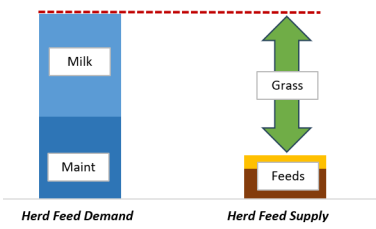
Grass utilised is a very significant and frequently quoted KPI for dairy systems, but it is perhaps somewhat misinterpreted at industry level. It is not a direct measure of grazing intensity on a paddock-by-paddock basis. It measures instead, by calculated difference, the contribution of home-produced forage to the overall annual feed energy requirement of the herd, on a kg dry matter per ha basis (Figure 2). Important factors in the calculation are stocking rate, milk solids and cow bodyweight to determine annual feed demand, from which purchased concentrate and forage brought in from external sources are deducted.
Annual pasture production data is not required for the calculation itself, but certainly high levels of pasture production and good daily management of allocations and residuals are prerequisites for achieving a high annual result. Where grass growth data is available for comparison, the utilisation figure will usually be around 80% of annual measured pasture dry matter production.
Figure 2. Schematic of pasture utilisation calculation at farm level
Some of the main strategic decisions for the farm, which may not initially be considered as ‘grass utilised’ factors, directly affect grass utilisation for example target median calving date, herd EBI policy, and land leasing. It is useful therefore to think of grass utilised as the end-of-year outcome of pasture growth, grazing management, soil fertility, herd performance, feed purchase and stocking rate decisions. When considered on this basis, it should make good intuitive sense as to why grass utilised relates strongly to farm profitability.
Figure 3: Grass utilised versus common margin per ha for ePM herds 2024
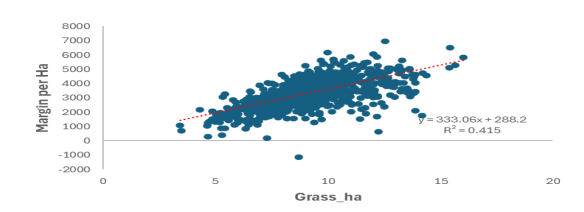
Analysis of 2024 ePM data (Figure 3) for dairy herds in ePM confirms the strong association between grass utilised and common margin per ha. Approximately 40% of the farm-to-farm difference in financial outcome is explained by this metric, which is a consistent finding across multiple years’ ePM data with varying milk price and cost scenarios.
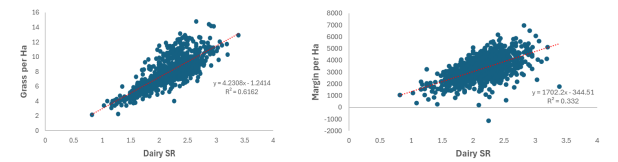
Stocking rate effects on cost and grass utilisation
The interactions between stocking rate and grass utilised is a key determinant of costs and margin per ha. Taken in isolation, stocking rate is positively associated with margin per ha and has an important role to play in driving grass utilised per ha (Figure 4). However, when stocking rate is analysed in conjunction with grass utilised (i.e. what happens if I increase stocking rate for no gain in grass utilised)’, the ePM data show that increasing stocking rate could have a negative association with margin per ha. In other words, the positive effect on margin of increasing stocking rate is not direct but is rather a ’grass utilised’ effect.
This is an important consideration for farms planning to increase (or decrease) stocking rate – what will the effect be on capacity to utilise grass, and how will this translate to margin? Where grass utilisation is currently limited by low stocking rate, increasing stocking rate is likely to improve margin per ha, provided that grass utilisation also increases. Data from ePM shows that profit outcomes will be less favourable if higher stocking rate results only in pro-rata increases in supplementary feed cost.
Where pasture production and management is good, and high grass utilisation is not currently limited by stocking rate, two broad scenarios tend to emerge in response to increasing stocking rate further i) the farm purchases additional supplementary feed to meet the additional demand resulting in a higher cost base or ii) the farm allocates the same total feed across more cows resulting in increased maintenance feed demand, no increase in milk productivity, and higher total non-feed costs on farm.
Figure 4: Relationship between SR and grass utilised per hectare and margin per hectare
Input costs, milk output measures and margin per hectare
A range of milk output and cost efficiency metrics were also tested against margin per ha using the eProfit Monitor data for 2024. As illustrated in Figure 5, lower cost per litre (and per kg milk solids, not graphed) was strongly associated with improved margin per ha. Similar trends were apparent across multiple years which further underlines the need for tight control of cash costs in the system, irrespective of milk price. In further analysis of the top and lowest margin per ha farms in ePM for 2024 were compared, 32% of the total difference in margin was due to direct cash costs. The lower margin farms had €387 per cow additional annual costs in 2024, distributed across a range of variable and fixed costs. Cost differentials explain an even higher proportion of the spread in margin in low milk price years, due to a smaller range in milk revenues between farms. Benchmarking costs on a line-item basis, whether using per cow, per litre or per kg milk solids as the reference value, is therefore an essential management practice, and is absolutely vital during periods of low milk price.
Figure 5: Relationship between margin, costs and concentrate feeding levels
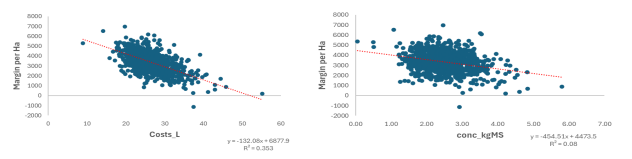
Also illustrated in Figure 5 is a trend toward lower margin per ha as concentrate fed per kg milk solids increases. Mean concentrate fed in the data was 2.48kg per kg milk solids sold (for example 1190kg concentrate fed 480kg milk solids on average). As concentrate feeding per kg milk solids produced per cow increased common costs and margin per ha reduced. Comparing also the top and lowest margin farms in 2024 (Table 3), higher margin farms had significantly lower concentrate fed per kg milk solids produced, had an estimated higher grass intake of 0.6tDM per cow, and achieved higher pasture utilised per ha). Additional milk solids output was driven by maximizing pasture eaten.
Table 3: Physical performance of dairy farms ranked by margin per hectare
| Farm stocking rate | Milk solids kg/cow | Milk solids kg/ha | Conc. cost €/MS | Conc fed kg per kg MS | Pasture Intake per cow tDM | Grass utilised ha tDM | |
| Top 10% | 2.43
2.92* |
522 | 1266 | 0.89 | 2.41 | 4.0 | 9.8 |
| Bottom 10% | 1.90
2.71* |
431 | 819 | 1.10 | 2.90 | 3.4 | 6.4 |
Collectively, these trends show that increasing milk output through supplementation inflates the cost base of the farm system and will reduce margin per hectare, whereas higher milk solids achieved through other means (breeding, fertility, pasture intake and quality) can contribute positively to financial returns. Caution is strongly advised against comparing farms or setting targets based on output-per-cow metrics alone.
Conclusion
Given the expected strong reduction in milk price projected for 2026, it is extremely important for all dairy farms to complete a simple cash flow budget, identifying costs within the farm that can be targeted to reduce. The reality is that reducing costs in 2026 should be prioritised. Those costs that are not resulting in a return should be targeted first. With current cow prices, the first key decision should be around matching pasture production with feed demand corrected for utilisation. For example, a farm growing 14t DM/ha has a carrying capacity of 2.5 cows per hectare, where the herd is delivering 480 to 500kg of milk solids and feeding 500kg of concentrate. Adjustments should be made from there based on pasture production, milk solids delivered and concentrate feed level.
For further insights from the Teagasc National Dairy Conference, visit here.