
InterPIG Figures for 2025
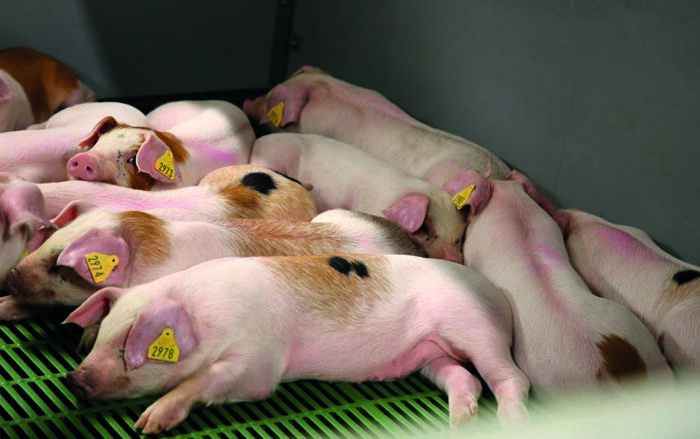
The figures from the InterPIG meeting which was held in Ireland in July 2026 have been finalised, Gerard McCutcheon tells us more
These are the figures that were presented by each country representing their performance in 2025. They are a benchmark by which we can compare our performance.
Please see the performance figures from Denmark, France, Spain, and the Netherlands below. They are shown alongside the Irish performance. The Irish figures represent over 74,500 sows or 55% of the national herd as compiled on the Teagasc Profit Monitor (PM) record analysis system. The figures for Ireland are the average performance from all herds in the PM database for 2025.
The figures relating to sow performance for several countries are shown below in Table 1.
Table 1 : Components of the number of pigs weaned/sow /year.
| Denmark | Spain | Netherlands | Ireland | |
| Born Alive / Litter | 18.9 | 14.7 | 16.2 | 15.4 |
| Pre-weaning Mortality % | 13.1 | 15.9 | 11.9 | 11.2 |
| Weaned / Litter | 16.4 | 12.4 | 14.3 | 13.6 |
| Litters / Sow / Year | 2.25 | 2.18 | 2.34 | 2.23 |
| Weaned / Sow / Year | 36.9 | 27.0 | 33.5 | 30.3 |
The born alive figures in Ireland have improved over the last number of years but we still have some way to go when we see what Denmark in particular is achieving. It is a question of what the optimum number of pigs born alive per litter is, as there is a lot of fostering required in the Danish system. While the Danes have a higher pre-weaning mortality, the number of pigs weaned still gives them a higher number of pigs produced per sow per year.
The number of pigs produced per sow is the number born alive minus all mortalities. It is a very good parameter to use to compare performance. The post-weaning mortality figures and the number of pigs produced/sow/year are shown below in Table 2.
Table 2 : Post weaning mortality and the number of pigs produced/sow /year.
| Denmark | Spain | Netherlands | Ireland | |
| Weaner Mortality | 3.9 | 7.6 | 1.8 | 3.6 |
| Finisher Mortality | 3.5 | 6.6 | 2.3 | 2.8 |
| Post Weaning Mortality | 7.4 | 14.2 | 4.1 | 6.4 |
| Pigs Produced/ Sow /Year | 34.2 | 23.2 | 32.1 | 28.4 |
Each country has a different liveweight at slaughter. It is highest in the Netherlands (124.5 kg), lower in Denmark (120.9 kg) and lowest in Spain and Ireland (119.9 and 119.5 kg LW respectively). The Danes achieved the best average daily gain (ADG) from weaning to sale, with Spain showing the lowest. These figures are shown below in Table 3.
Table 3 : Feed performance from weaning to sale.
| Weaning to Sale | Denmark | Spain | Netherlands | Ireland |
| Total Days Weaning to Sale | 135 | 174 | 160 | 142 |
| Kg of Gain- Weaning to Sale | 114.7 | 113.8 | 117.8 | 112.2 |
| Kg of Feed | 259 | 266 | 276 | 266 |
| ADG (g/day) | 848 | 655 | 736 | 790 |
| FCE Weaning to Sale | 2.26 | 2.33 | 2.35 | 2.37 |
The best feed per kg of carcase was achieved in the Netherlands where 3.26 kg of feed was used to produce one kg of carcase. These figures are shown in Table 4.
Table 4: Replacement rate and calculation of kg of feed per kg of carcase.
| Denmark | Spain | Netherlands | Ireland | |
| Carcase Weight Sold kg | 3,109 | 2,097 | 3,161 | 2,593 |
| Total Feed /Sow/Year kg | 10,319 | 7,358 | 10,296 | 8,980 |
| Kg Feed per kg Carcase | 3.32 | 3.51 | 3.26 | 3.46 |
Our growth rates compare favourably to the Dutch but are lower than the Danes. Our feed conversion figures are higher than the Danes and the Netherlands. We need to reduce this performance differential to remain competitive at an international level.