
18 December 2023
Lessons on pasture utilisation and meal feeding to be learned from 2022
2022 was an extraordinary year on Irish dairy farms. Although input price volatility overshadowed much of the year, dairy incomes still managed to hit record highs on the back of all-time high milk prices.
With volatility now seemingly an ever-present feature in dairy markets, Dr Joe Patton aimed to shed light on how farmers reacted to rising milk, fertiliser and meal prices over the course of 2022 and how their decisions impacted on the margins obtained.
Presenting to delegates at the recent Teagasc National Dairy Conference, the Head of Dairy Knowledge Transfer at Teagasc posed a number of questions, such as:
- Did dairy farms react to high input prices by changing input usage?
- Did high milk price drive changes in inputs?
- What were the outcomes separate to changes in milk price?
- Are there long-term consequences for farm management decisions?
To answer these questions, Joe presented an analysis of 100-profit focused farms, as measured through Teagasc eProfit Monitor completion over the past five years.
Explaining the reasoning for the analysis, Joe said: “We know prices changed this year, but relative to last year when we did get very high input costs and a very high milk price, farmers made certain decisions and we really want to know what signals drove decisions on farm – we had signals around input costs and we had signals around milk price.
“The concern we had was that when milk price was very high and it was historically high last year, it almost comes to the point on some farms where we see all bets are off in terms of cost control and the focus on grass utilisation and grass production.”
To see the cost changes that occurred and to gain an understanding of how farmers reacted to changing input and output price points in 2022, profit monitor data from these 100 farms were compared between 2019 and 2022.
These farms were larger in scale and operating at a higher intensity than the national average. As a result, no inferences regarding national average costs or margins should be drawn from this data. Instead, the trends and outcomes provide a very useful picture of management trends, as labour costs and land lease charges were excluded to generate common input costs across the sampled farms.
Table 1: Summary cost and feed budget data for sample of 100 eProfit Monitor herds
| 2019 | 2022 | Difference | |
|---|---|---|---|
| Cows | 163 | 182 | 19 |
| Farm stocking rate | 2.42 | 2.46 | 0.04 |
| Milking platform stocking rate | 2.99 | 3.04 | 0.05 |
| Milk solids per cow | 497 | 511 | 14 |
| Costs (€/cow) | |||
| Fertiliser | 177 | 294 | 117 |
| Purchased feed | 312 | 527 | 215 |
| Contractor | 160 | 188 | 28 |
| Other variable costs | 263 | 381 | 118 |
| Total variable costs | 912 | 1,390 | 478 |
| Common fixed costs | 465 | 541 | 76 |
| Common costs total | 1,377 | 1,931 | 554 |
| Margin per hectare* | 1,639 | 3,792 | 2,153 |
*Before land, labour and capital repayments
Commenting on the results of this analysis, Joe explained that there was a very significant increase in the annual input costs on a per cow, per kilogram of milk solids and per hectare basis from 2019 to 2022. On a common cost basis, excluding labour and land lease costs, costs per cow increased by €554, or a 40% increase in costs per cow. Farm stocking rate remained relatively constant over this time-period, therefore the trends in per cow and per hectare costs ran in parallel.
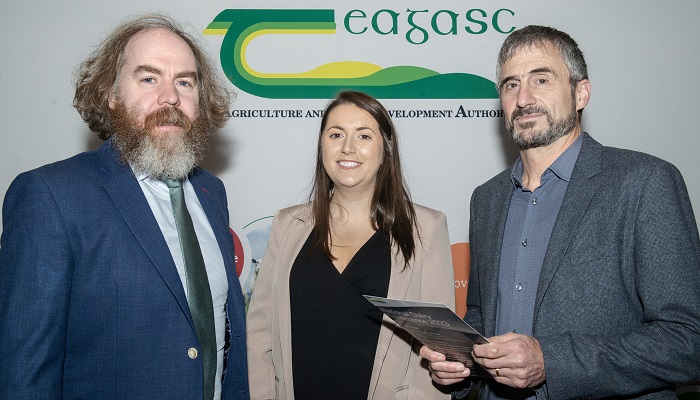
Pictured at the National Dairy Conference from left to right are: Dr Joe Patton, Head of Dairy Knowledge Transfer, Teagasc; Dr Emma-Louise Coffey, Teagasc; and Mr David Beca, Red Sky Agri, Australia.
Giving a breakdown of the variable cost changes that occurred, which resulted in the variable costs increasing by €480 per cow on these sampled farms, Joe explained: “We focused a lot on fertiliser costs in 2022 and there were decisions made on the input of fertiliser, but feed costs on a per cow basis actually increased at nearly double the rate that fertiliser did.”
He noted that fertiliser cost changes accounted for 21% of the total increase in common costs per cow. The cost per tonne differential accounted for over 100% in the differential in fertiliser cost, as farmers in the dataset reduced usage per hectare.
Purchased feed accounted for 39% of the total change in common costs. Approximately two thirds of the total cost per cow difference was due to unit price. However, unlike fertiliser, which saw a reduction in usage due to price, concentrate fed per cow increased by 29% to 1,229kg per cow.
Milk solids and grass utilised
Despite this increase in direct supplement cost per cow, the overall milk solids production per cow difference was relatively minor at 14kg solids per cow. With farm stocking rates remaining similar, the milk output per ha differences were likewise minor.
“We can’t see it from the data but you can speculate as to whether the increased concentrate happened as a result of a reaction to milk price, where people chased milk with more concentrate or was it a replacement of the pasture that wasn’t grown in that particular year – it could be one or the other,” Joe explained.
“From an output perspective, we increased our concentrate feed by about 270kg per cow. Our pasture utilised, which is one of our key metrics, declined by about 500kg of dry matter per hectare in 2022, but we got about 14kg of milk solids for the additional concentrate fed at a similar stocking rate.
“When we correct that for differences such as improvements in the breeding indexes for solids, we estimate that 8kg of solids was the increase in production per cow for the 270kg of concentrate, which was pretty sobering. Even in a high milk price year, that’s a negative return.”
This occurred as the annual concentrate feed rate per cow has a moderate to weak relationship with solids per cow, with Joe adding: “Concentrate feeding rate only explained about 14% in the variation in solids per cow. There is an awful lot more going on it terms of productivity than just the concentrate feed level, even though a lot of our conversations seem to be around defining our system based on the level of concentrate when it is actually irreverent.”
Despite the reduction in pasture utilised, Joe noted that it had a strong positive relationship to margin per hectare both in 2019 and 2022, illustrating consistent effects across years with very different price and cost bases.
“In two very different years, the ratio between pasture utilised and margin per hectare remains the same. It doesn’t matter whether the milk price is 40c/L, 50c/L or 60c/L or concentrate is €300/t, €400/t or €500/t, the relationship between pasture utilised and profit per hectare remains the same,” Joe said.
As part of the analysis, Joe also examined the relationship between cost per litre and margin per hectare, indicating that it was strongly linked.
“Discipline on cost control is not a low milk price year activity,” he explained. “From 100-profit focused farms, it really emphasises that pasture utilised per hectare and cost control are the things that drove the difference in margin. Even though an awful lot of that was hidden in 2022 under the higher milk price and the perception that changing the feed budget would pay off, we can see through the differences in output values there was no economic response to the change in feed budget at all,” he said.
Concluding his presentation, Joe said: “We really need to learn a lesson from 2022 and keep focusing on pasture utilised – whether it is a historically high milk price year or not, it still remains the key thing to focus on.”
For more from Joe’s presentation from the National Dairy Conference, click here.
Also read: Viewing labour as an asset not a cost
Also read: Agriculture must work to meet skills and labour shortages
Also read: Successful Teagasc National Dairy Conference
Also read: Stabilisation of water quality needed to secure nitrates derogation post 2025