Performance on Irish pig farms over the years
The latest performance data for the Irish national pig herd highlights the improvements achieved in productivity, growth rates and feed efficiency over the past 25 years. Gerard McCutcheon, Teagasc Pig Production Specialist, tells us more.
There has been a steady rise in performance on pig farms over the years. One key performance indicator (KPI) that is often compared is the number of pigs produced per sow per year. It is interesting to look at the number of pigs produced per sow per year over time. This parameter is calculated as the number of pigs born alive minus all mortalities on the farm, divided by the average number of sows in a year.
View the National Pig Herd Performance Report 2025
In 2000, the average number of pigs produced per sow was 21.5. This increased to 23.9 in 2010 and, in the most recent dataset for 2025, this figure has risen to 28.4. The biggest contributing factor to this increase is the average number of piglets born alive per litter, which rose from 10.85 in 2000 to 15.43 in 2025. Genetic improvements and nutritional management have contributed greatly to this rise in sow performance. Table 1 below shows the breakdown of the figures contributing to this KPI.
Table 1: Pigs Produced per Sow per Year in 2000, 2010 and 2025
| Measures of sow performance | 2000 | 2010 | 2025 |
|---|---|---|---|
| Litters/sow/year | 2.29 | 2.32 | 2.23 |
| Born alive/litter | 10.85 | 12.01 | 15.43 |
| Piglet mortality (%) | 9.0 | 9.9 | 11.2 |
| Weaner mortality (%) | 2.6 | 2.4 | 3.6 |
| Finisher mortality (%) | 2.3 | 2.5 | 2.8 |
| Pigs produced/sow/year | 21.5 | 23.9 | 28.4 |
Source: Teagasc Profit Monitor
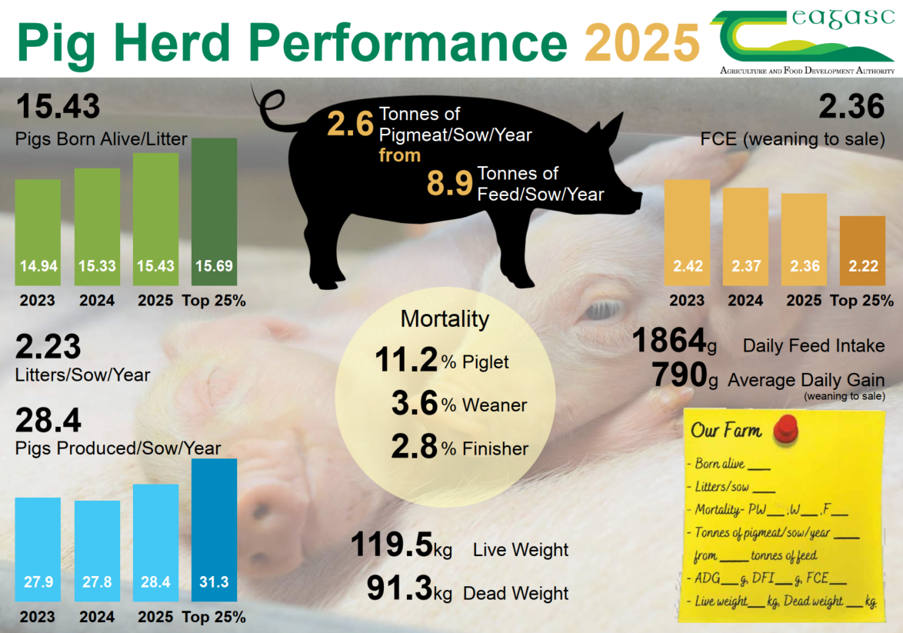
The Pig Herd Performance infographic presents performance for 2025, including key metrics such as pigs born alive per litter (15.43), feed conversion efficiency (FCE) from weaning to sale (2.36), and daily feed intake (1864g) with average daily gain (790g).
Download the infographic here: Pig Herd Performance 2025 Infographic
The second KPI that is often examined is growth rate, or average daily gain (ADG), measured in grams of liveweight gain per day. Table 2 below shows the average daily gain from weaning (when pigs are removed from the sow) to the time of sale. The ADG was 585 g/day in 2000, rising to 668 g/day in 2010 and reaching 790 g/day in 2025. The increased growth rate from weaning to sale allows a heavier pig of 119.5 kg liveweight to be produced in 142 days post-weaning, which is the same amount of time it took in 2000 to produce a 90.1 kg pig with a lower growth rate.
The third KPI is feed conversion efficiency (FCE), which is the weight of feed (kg) required to produce one kilogram of liveweight gain. Table 2 below shows the FCE at 2.34 in 2000. This is no surprise, as FCE is usually lower with a lighter sale weight. The breeding of leaner genetic lines and good nutritional management has achieved an FCE of 2.36 at a heavier liveweight (32% heavier) in 2025.
Table 2: Feed Performance from Weaning to Sale in 2000, 2010 and 2025
| Performance from Weaning to Sale | 2000 | 2010 | 2025 |
| Liveweight at sale (kg) | 90.1 | 103.6 | 119.5 |
| Deadweight at sale (kg) | 68.1 | 78.9 | 91.3 |
| ADG (g/day) | 585 | 668 | 790 |
| Feed conversion efficiency (FCE) | 2.34 | 2.47 | 2.36 |
Source: Teagasc Profit Monitor