Following the recent release of the 2025 Beef Calving Statistics Report by the ICBF, Teagasc Beef Specialist, Catherine Egan encourages suckler farmers to sit down and examine their herd’s performance, as calving interval is going in the wrong direction nationally.
Providing a comprehensive analysis of a suckler herd’s fertility performance for the period July 1, 2024, to June 30, 2025, suckler herds signed up to the ICBF’s HerdPlus serviced recently received their 2025 Beef Calving statistics report – a valuable document highlighting key areas for improvement.
Worryingly, calving interval and calves per cow per year metrics are going in the wrong direction. Tables 1 shows the national averages for calving interval as well as giving a breakdown by herd size and scheme participation. The national average figure of 400 day calving interval is increased in non-SCEP herds to 411 days and decreased in SCEP herds to 393 days, while herds that are participating in SCEP and HerdPlus are the lowest at 390 days. However, all categories are well above the national average target of 365 days.
Table 1: Calving Interval national average and averages for different herd sizes and scheme participation (Source: ICBF)
| Herd size | All | SCEP | Non-SECP | SCEP and HerdPlus |
| National average | 400 | 393 | 411 | 390 |
| 10-14 | 404 | 395 | 411 | 392 |
| 15-19 | 402 | 395 | 411 | 393 |
| 20-29 | 398 | 391 | 412 | 389 |
| 30-39 | 397 | 393 | 409 | 391 |
| 40-49 | 396 | 392 | 413 | 389 |
| 50-74 | 394 | 391 | 414 | 389 |
| 75-99 | 390 | 397 | 410 | 385 |
| 100+ | 393 | 391 | 409 | 389 |
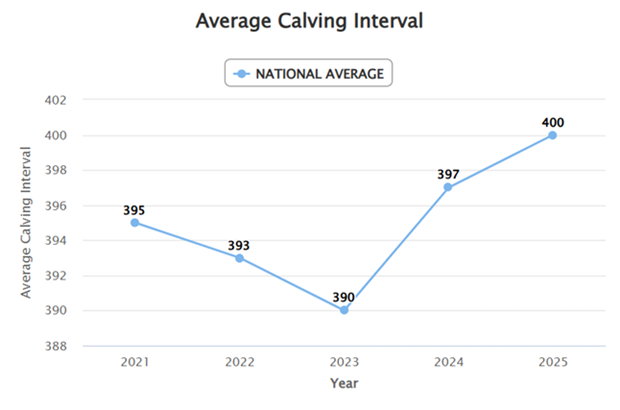
On review of the past five years, this figure has decreased from 395 days in 2021 to 390 days in 2023 but has increased since to 400 days in 2025 as seen in figure 1 below.
Figure 1 : 5 year trend of national average calving interval (Source: ICBF)
A profitable suckler beef enterprise requires each cow to produce a viable calf every year. Failing to reach this target means a cow’s output doesn’t cover the expense of keeping her, negatively impacting the farm’s net margin and carbon footprint.
To achieve this, improving fertility through better nutrition, health and management are required to reduce the calving interval and maximise the number of live calves born and weaned each year. The 2025 national average figure as show in Table 2 is 0.85 calves/cow/year which equates to 85 calves per 100 cows. This figure increases for SCEP herds to 0.87 caves/cow/year and 0.88 for herds in SCEP and HerdPlus.
Table 2: Calves/cow/year national average and averages for different herd sizes and scheme participation. (Source: ICBF)
| Herd size | All | SCEP | Non-SCEP | SCEP and HerdPlus |
| National average | 0.85 | 0.87 | 0.82 | 0.88 |
| 10-14 | 0.83 | 0.85 | 0.81 | 0.86 |
| 15-19 | 0.84 | 0.86 | 0.82 | 0.86 |
| 20-29 | 0.86 | 0.88 | 0.82 | 0.88 |
| 30-39 | 0.86 | 0.87 | 0.83 | 0.88 |
| 40-49 | 0.86 | 0.87 | 0.81 | 0.88 |
| 50-74 | 0.87 | 0.88 | 0.81 | 0.88 |
| 75-99 | 0.89 | 0.9 | 0.82 | 0.91 |
| 100+ | 0.89 | 0.89 | 0.86 | 0.9 |
At a 400-day national average calving interval, the average suckler cow is caving every 13 months. 0.85 calves/cow/year means, for every 100 suckler cows, there are only 85 calves being produced. Have you examined your herd’s performance? If seeking improvement, speak to your local Teagasc advisor.
To view more information on the beef calving statistics, including breakdown by county, additional KPIs etc, visit 2025 Beef Calving Statistics Highlight Suckler Herd’s Fertility Performance – ICBF
More from Teagasc Daily: Scope for earlier and more compact calving in suckler herds