
Teagasc launches Farm Enterprise Factsheets and Farm Survey Final Results
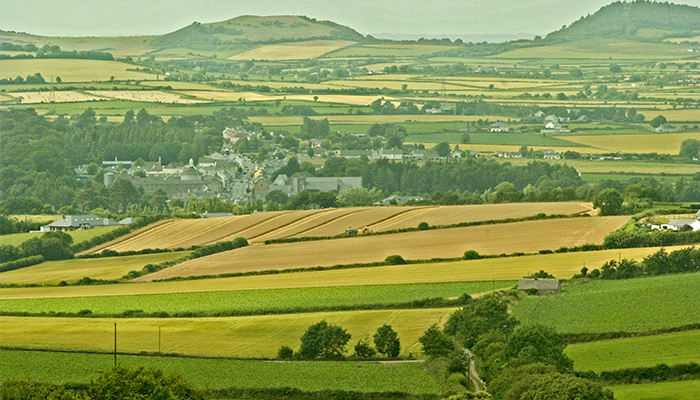
Teagasc has published its National Farm Survey (NFS) Farm Enterprise Factsheets for 2025, providing a clear picture of the financial and technical performance of a range of farm enterprises in Ireland last year.
Results are available for milk production, a range of cattle enterprises, mid-season lowland sheep and cereals. A detailed breakdown of enterprise level production costs and margins is included. Results are based on over 800 farms participating in the Teagasc NFS.
Unlike farm incomes, enterprise margins exclude most agricultural support payments, providing a transparent assessment of how much market-based profit is achieved by each farming activity. As well as examining the average margins achieved in each farm enterprise, the Enterprise Factsheets also report the performance of those above and below the average.
The Enterprise Factsheets illustrate the continued high production cost base facing agriculture in Ireland. Input costs have been particularly high in agriculture since 2022. However, in 2025 output prices rose to a level that helped to generate a substantial improvement in enterprise margins in Irish milk production and in the various cattle enterprises. While margins for some Irish cereal crops improved in 2025, this increase was relative to the very low margins recorded in 2024. Sheep enterprise margins in Ireland in 2025 fell slightly.
Enterprise database
The data presented in the Enterprise Factsheets is reproduced over several years in the companion Enterprise Dashboard, which has now been updated to include data for 2025. The Dashboard offers the opportunity to explore the available data in far more detail than the hard copy version. Users can track the longer-term development in output prices, production costs, profit margins, and aspects of farm enterprise technical performance across Irish dairy, cattle, sheep, and tillage enterprises. With almost 15 years’ worth of data now included in the Dashboard, users can also make comparisons across enterprises as well as reviewing trends over time.
The launch of the Enterprise Factsheets coincides with the publication of the final results of the 2025 National Farm Survey. The results confirm the strong increase in income across the main farm enterprises in Ireland in 2025 which was flagged in the preliminary results published earlier this year.
Table 1: Teagasc NFS Summary Results for Average Farm Incomes 2021 to 2025
| Farm System | 2021 | 2022 | 2023 | 2024 | 2025 | ’25 v ’24 | ’25 v ’24 |
| € | € | € | € | € | % change | € change | |
| Dairy | 102,881 | 157,591 | 51,122 | 108,536 | 154,988 | 43% | 46,452 |
| Cattle Rearing | 10,921 | 8,767 | 6,996 | 13,862 | 23,291 | 68% | 9,429 |
| Cattle Other | 17,265 | 18,097 | 13,737 | 18,141 | 34,247 | 89% | 16,106 |
| Sheep | 20,658 | 16,086 | 12,953 | 27,449 | 30,503 | 11% | 3,054 |
| Tillage | 56,197 | 73,523 | 19,280 | 41,391 | 55,419 | 34% | 14,028 |
| Average | 35,332 | 46,313 | 19,281 | 36,234 | 54,606 | 51% | 18,372 |
Source: Teagasc National Farm Survey
Table 2: Teagasc NFS Summary Farm Incomes Five-Year Average 2021 to 2025
| Farm System | Five-Year Average 2021-2025 | 2025 | ’25 v 5yr average | ’25 v 5yr average |
| € | € | % change | € change | |
| Dairy | 115,024 | 154,988 | 35% | 39,964 |
| Cattle Rearing | 12,767 | 23,291 | 82% | 10,524 |
| Cattle Other | 20,297 | 34,247 | 69% | 13,950 |
| Sheep | 21,530 | 30,503 | 42% | 8,973 |
| Tillage | 49,162 | 55,419 | 13% | 6,257 |
| Average | 38,353 | 54,606 | 42% | 16,253 |
Source: Teagasc National Farm Survey