02 May 2025
Trial Results: Crude Protein in Finisher Diets
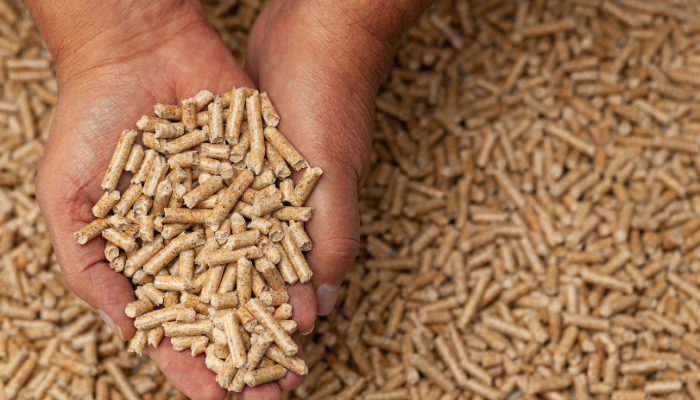
Kieran Keane tells us about a recent trial at the Moorepark Pig Research Facility examining how different crude protein levels in finisher diets impact pig performance, feed efficiency, and profitability, and why ingredient analysis is key to getting it right.
We conducted a trial in the Moorepark Pig Research Facility last year to assess the animal performance and ammonia emission impacts of feeding different levels of crude protein (CP) in our finisher diets. There were 3 diets in the trial: 16%CP, 14%CP and 12%CP. Although the crude protein varied, we formulated the diets to keep SID lysine at a constant 1% and the amino acid ratios the same. We also kept Net Energy at 10MJ/kg for all diets. These diets were fed over a 68-day period to finishers starting at approx. 42-44kgs. See the table below for Average Daily Feed Intakes (ADFI), Average Daily Gain (ADG), final average weight and Feed Conversion Ratio (FCR).
Table 1. Intake, Growth and Performance
|
Diet |
ADFI (kg/day) |
ADG (kg/day) |
Final Average Weight (kg) |
FCR |
|
A – 16%CP |
2.93 |
1.25 |
129kg |
2.33 |
|
B – 14%CP |
2.86 |
1.13 |
121kg |
2.53 |
|
C – 12%CP |
2.45 |
0.93 |
106kg |
2.63 |
Daily intakes were similar on the 16CP and 14CP diets but lower on the 12CP diet. This was obvious to us from an early stage and was even apparent from the feed silo contents. The energy in all diets were the same but the 12CP diet had a 65% barley inclusion which would have meant that it contained more fibre than the other 2 diets (NDF 12.1% vs 9.3%).
The average growth rate of the pigs on the 16CP diet was 120g per day ahead of the 14CP fed pigs and 320g per day ahead of the 12CP fed pigs. The feed conversion rate ranged from 2.33 to 2.63 across the treatments. This FCR difference would translate to a €0.5m differential in the annual profitability of a 700-sow unit when all input costs are considered. This is possibly the reason that there are not too many finisher diets formulated at 12%CP!
However, this doesn’t tell the full story. The table below shows what was actually fed to the pigs. The diets were formulated using our feed formulation software package with standard crude protein matrix values for each ingredient. The crude protein content of the main bulk ingredients (barley, wheat, maize and soya) and the resultant diets were analysed using wet chemistry in the Moorepark Feed Nutrition lab. The feed for the 10-week trial was made in 2 separate batches 5 weeks apart. The recipe stayed the same, but the raw ingredients were from different loads for the 2 batches. This resulted in large changes to the dietary crude protein. The table below shows the intended crude protein content in formulation and the actual resultant dietary crude protein of each batch of feed. It also shows the crude protein of the ingredients as per formulation and in reality.
Table 2. Formulated CP and actual CP of diets and ingredients
|
|
Formulated CP |
Batch 1 CP |
Batch 2 CP |
|
Diet |
|
|
|
|
A – 16%CP |
16.0% |
15.4% |
14.6% |
|
B – 14%CP |
14.0% |
13.6% |
12.6% |
|
C – 12%CP |
12.0% |
11.9% |
10.8% |
|
Raw Mat. |
|
|
|
|
Barley |
10.0% |
10.5% |
8.8% |
|
Wheat |
10.5% |
9.6% |
9.6% |
|
Maize |
8.1% |
7.6% |
7.0% |
|
Soya |
47.2% |
47.0% |
47.0% |
Although the diets were formulated at 16%,14% and 12%CP, due to ingredient variability the first batch of each feed had a slight decrease in crude protein and the second batches of each had a further about 1% decrease in crude protein. So, when comparing growth and performance on the first table we are in fact comparing 14.6, 12.6 and 10.8% CP for the last 5 weeks of the trial. The difference in growth rate towards the end of the trial was almost 400g per day between the highest and lowest crude protein diets. In addition, as crude protein is reduced per ingredient, so are lysine and other amino acids whilst the proportions of starch, fat and/or NDF will rise in its place. This may further explain the difference in intakes across the 3 diets.
However, if we go back to the Table 2 above and we had been pre-armed with the ingredient analysis we would have formulated differently. Table 3 below shows the impacts of reformulating the diets back to the intended crude protein levels. In this case, I only changed the bulk ingredients listed on the first table thus keeping the premix the same for each diet. This was done to both batches of each diet and the composite price increases shown below. The first column below shows the extra cost per tonne of feed produced based on ingredient costs. The second column shows the improvement in FCR I have allowed in the model as a result of reformulating. This is a very moderate improvement, particularly to the 14% diet which could improve by 0.15 FCR points. The third column shows the annual financial benefit to a 700-sow farm if we were to reformulate allowing for the extra feed cost.
Table 3. Formulated CP and actual CP of diets and ingredients
|
Diet |
Extra Cost per Tonne to reformulate to intended CP |
FCR change |
Modelling cost per annum unit saving if reformulated |
|
A – 16%CP |
€3.92 |
-0.025 |
€25,740.00 |
|
B – 14%CP |
€4.84 |
-0.05 |
€ 51,505.00 |
|
C – 12%CP |
€6.01 |
-0.05 |
€39,985.00 |
Alas, hindsight is great. In an ideal world, ingredients would remain the same and we wouldn’t need to try to predict these occurrences. However, if we knew what our ingredient proximate analysis was before using them, we could reformulate diets more frequently and without some of the safety margins we allow for today thus saving money on feed in that way. That is what we are trying to achieve in our Feed Nutrition Lab in Moorepark and why lab analysis is important and will save pig producers money.