
Is nitrogen distributed evenly across your farm?
Chemical and organic fertiliser may be applied evenly across a farm throughout the year, but it may not get taken up evenly.
For example, some fields have more grazings than others, some have more silage cuts. The nitrogen (N) that cows get from grazing grass is converted into milk and meat production and that gets exported off farm through sales.
Across grassland farms in Ireland, the distribution of nitrogen is uneven when viewed across individual fields. This uneven distribution results in some fields having a surplus level of nitrogen that can’t be utilised by the soil and grass, and other fields have a deficit level of nitrogen that impacts grass yield potential.
This uneven distribution of N within a farm reduces profitability and creates inefficiencies. There is an environmental cost of these imbalances also which can contribute to greenhouse gas emissions and a deterioration in water quality.
In a recent publication by Teagasc in the journal Agricultural Systems, researchers calculated the N balance for every individual field on 15 working dairy farms in Cork, Tipperary and Wexford (Figure 1) and tracked the changes in N use over a three-year period (2015 to 2017). The average N balance within each farm after three years was shown to the farmer in the form of a field level farm map (Figure 2).
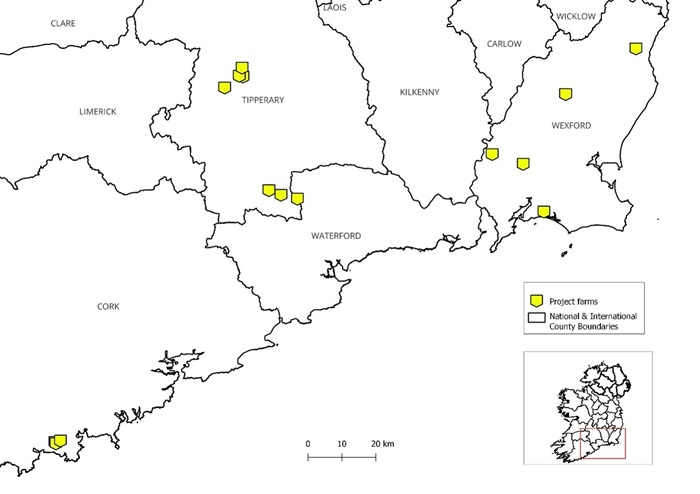
Figure 1: Map showing the distribution of participants across the south and southeast of Ireland in a study on the nitrogen balance on 15 commercial dairy farms.
On-farm best practice insights
Differences between grazing platforms
From a farmer’s perspective, one of the main insights in this study was that fields on the milking platform had equally high N balance values when compared to fields outside the milking platform. The ‘milking platform’ is the land directly accessible to dairy cows used for milking i.e. the grazing area immediately surrounding the milking parlour. Fields on the milking platform had an average N balance of 149 kg N ha-1 across the 15 farms while fields not used for grazing dairy cows or producing silage had a similar average N balance of 139 kg N ha-1. This was surprising as the grazing intensity is much lower on these fields and so a significant inefficiency in N use was identified.
Adjusting N rate for clover content
A number of other field level inefficiencies of N use were identified in the study. Fertiliser N input did not differ between clover and non-clover swards. There was no difference in the average N input between a field with clover and a field without clover. This indicated that farmers in this study had significant potential to reduce chemical fertiliser N import on clover-containing swards to better utilise the N fixing capacity of legumes.
Consider sward age
The study also found that average N input in inorganic and organic fertiliser was greatest on fields reseeded between 5 and 10 years ago compared to newly reseeded fields (reseeded less than 5 years ago). The N use efficiency was lowest on these fields, suggesting that farmers may have been increasing the fertiliser application on older swards because they are not achieving the yield that would perhaps be expected from a younger sward.
Increase soil fertility
Finally, on average, just 6% of fields were categorised as optimal for soil pH, phosphorus, and potassium – just 27 out of 484 fields sampled. There was significant scope to improve field scale soil fertility on these farms which would be expected to improve N use efficiency and reduce N surplus across the whole farm over time.
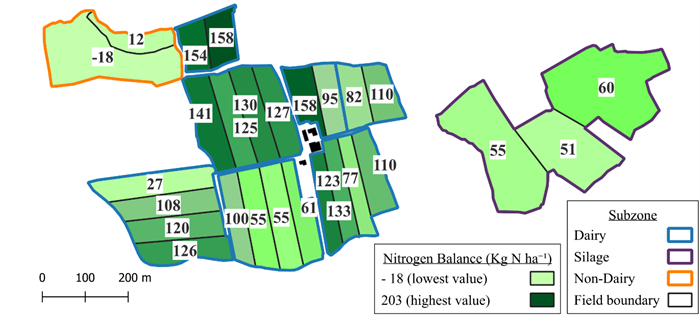
Figure 2: Farm map showing the individual fields and their average N balance value after 3 years (2015-2017). The farm map also highlights how it is divided up into three “subzones” – Dairy (milking platform), Silage (silage fields), and Non-Dairy (out-block) subzones.
Research insights
From a research perspective, the methodology used to calculate N balance across multiple scales (farm, subzone, and individual field) showed that at farm level N balance is a good indicator of the average N balance across a farm but it masks the large variability in actual N balance within the farm. This means there is opportunity to improve nitrogen and nutrient management plans by accounting for factors that drive field level N imbalances.
The study suggests that the environmental pressure is greatest on the milking platform due to results showing these fields have the highest N surplus. This pressure could be mitigated through reduced N input on clover swards and older swards. The economic risk (input costs and potential profit) is greatest on the fields outside of the milking platform and not used primarily for silage, as indicated by their low nitrogen use efficiency.
Current policy perspective
Ireland’s Sixth Nitrates Action Programme (NAP) for 2026-2028 published on 8th December 2025 has made it mandatory for derogation farms to calculate an N balance for their farm. The Sixth NAP also has a requirement to “demonstrate distribution” of nutrients across the whole farm to prevent or avoid an excess of nutrient loading on the milking platform of dairy farms.
The full paper ‘Assessing nitrogen balance and use efficiency across multiple scales on pasture based dairy farms and implications for nitrogen management and policy’ can be read in the journal Agricultural Systems.
Reference: Murphy, P.M., Murphy, P.N. and Wall, D.P., 2026. Assessing nitrogen balance and use efficiency across multiple scales on pasture based dairy farms and implications for nitrogen management and policy. Agricultural Systems, 236, p.104746.
For more on climate and biodiversity research in Teagasc, visit the Teagasc Climate Centre
For information on the Teagasc Better Farming for Water Campaign visit here.