

Grassland
- Growth rates have increased to 55 kg DM/ha/day
- Good covers with 33 days ahead
- Increasing demand with cows calving


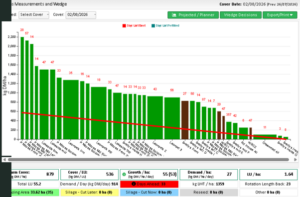
Figure 1 Grass wedge on 2nd August 2026
The grass wedge on 2nd August shows a strong supply of grass on the farm, with an average farm cover of 879 kg DM/ha and growth running at 55 kg DM/ha/day, compared with a demand of just 27 kg DM/ha/day.
There is currently 33 days of grass ahead, indicating that grass supply is well ahead of livestock demand. The wedge has a good number of paddocks available at covers around 900–1,300 kg DM/ha, while a number of heavier covers are present at the start of the rotation.
With growth running at twice demand, grass is accumulating faster than it is being grazed. The farm is therefore carrying more grass than required for the current rotation. Demand will be increasing as cows have started calving and Trevor also has the option of removing surplus grass. As we are now into August he is well ahead for building covers coming into the autumn. At a growth rate of 55 kg DM/ha/day, continued strong growth could quickly add further grass to the wedge if demand does not increase.
Three water troughs are to be added to the new land being farmed this year which will allow the fields to be closed off into smaller paddocks.
One of the pedigree Saler bulls was sold for breeding on 20th June. The remaining pair are on 12kg of ration/head/day and will be finished around 700 and 800kg live weight respectively.
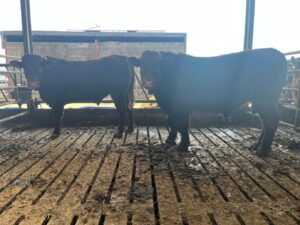
Figure 2 Two Saler that are being finished
The weanling bulls are eating 3.5kg of ration/head/day at grass and were gradually built up by 0.5kg/week since June. Five of these were sold privately on 4th August with the remainder to be sold by the end of the month.
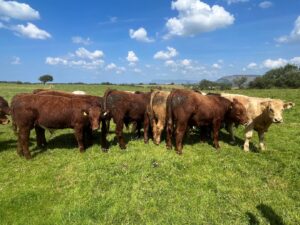
Figure 3 Some of the yearling bulls
Trevor’s Beef Benchmarking Report came available on ICBF on 28th June. It runs from April 2025 to March 2026 and summarised the finishing performance of 17 beef heifers and 20 dairy beef heifers that were sold during that time.
For the beef heifers it showed the following data:
It also compared the finishing performance across the commercial beef value (CBV). The top third of the CBV animals had a lower lifetime ADG at 0.85 kg/day vs. 0.88 kg/day as they were 68 days older than the bottom third when finished. However they had a heavier carcass weight of 282kg vs. 243kg and graded better at R= instead of O+.
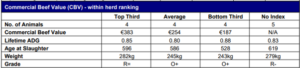
Figure 4 CBV vales of beef x beef heifers finished April 2025- March 2026 (Source: ICBF)
The dairy beef heifer data was as follows:
The CBV differences were more obvious in this group of heifers, which the top third CBV ones achieving a higher ADG of 0.77kg/day vs. 0.73kg/day in the bottom, 20 days older at age at finish at 639 days vs 619 days, a higher carcass weight of 256kg vs. 225kg and a higher grade at O+ vs. O=.
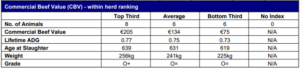
Figure 5 CBV vales of dairy x beef heifers finished April 2025- March 2026 (Source: ICBF)
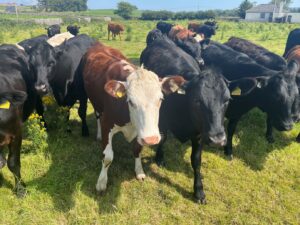
Figure 6 Some of this year’s dairy beef heifers